
Fig 6. Summary of data obtained for CT5 and the NANOG locus.
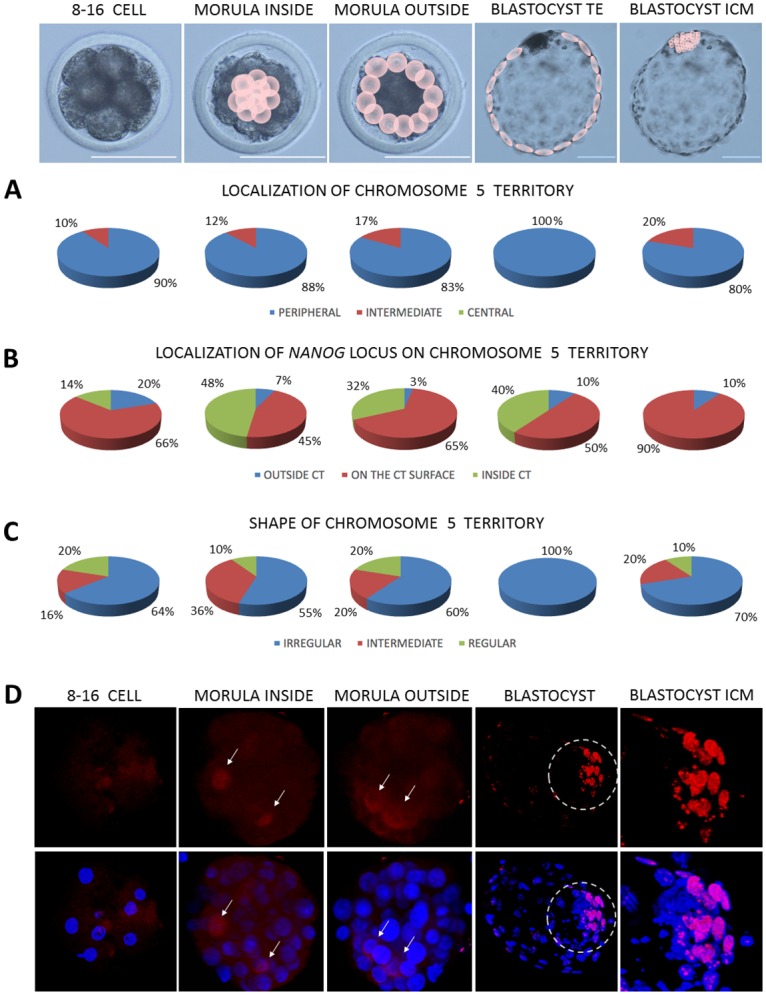
Top panel presents the analysed developmental stages, pink circles point to cells for which analyses were carried out at morula and blastocyst stages. (A) summarises the contribution of peripheral, intermediate and central location of CT5 within the analysed nuclei, (B) shows the localisation of the NANOG locus in relation to its CT, (C) indicates the changes in CT5 shape related to embryonic stage. (D) presents NANOG localisation (red immunofluorescence) in bovine embryos. The encircled region indicates the ICM, highlighted in the far right images. Arrows indicate NANOG positive cells in morula inner and outer cells. Chromatin was visualised by DAPI, confocal sections were taken every 4μm. Scale bar: 100μm.