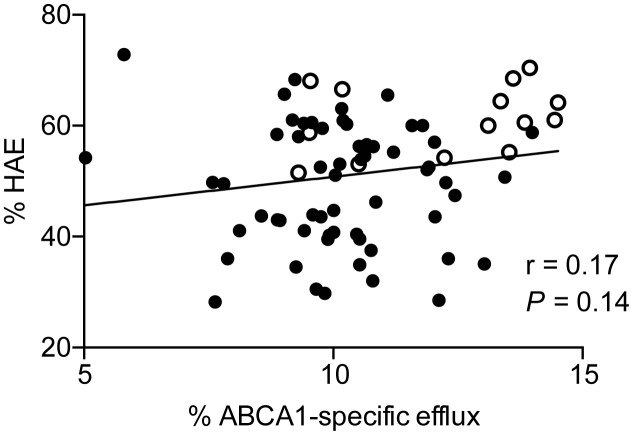
Fig 2. Correlation of ABCA1-specific CEC and HAE.
Correlation was determined by linear regression analysis using Pearson’s correlation coefficicent. (●) MetSyn (o) Control. Exclusion of one subject with HAE of 72.8% and ABCA1-specific CEC of 5.8% yields a significant relationship where r = 0.26, P = 0.03.

