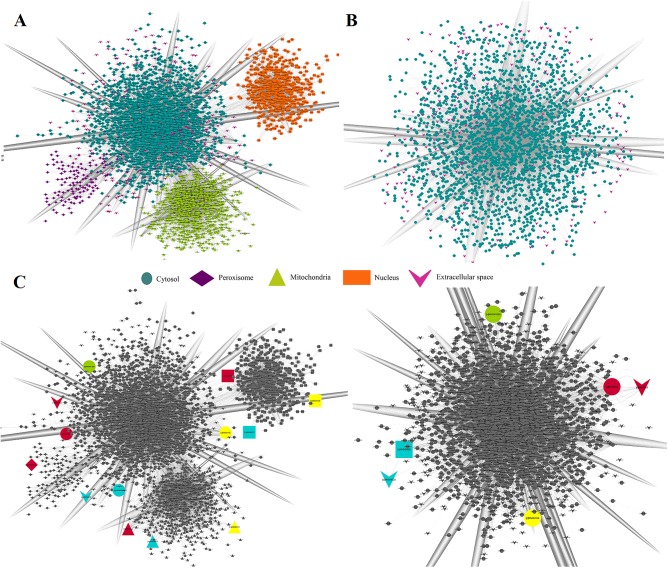
Fig 5.
Graph representation of metabolic networks: (A) the compartmentalized, non-intervened soil sample and (B) the non-compartmentalized, non-intervened soil sample. In metabolic networks, the nodes represent the metabolites and the links represent the biochemical reactions. (C) Comparison between metabolites in compartmentalized and non-compartmentalized networks. The same color highlight the same metabolite in both networks.

