Fig. 4.

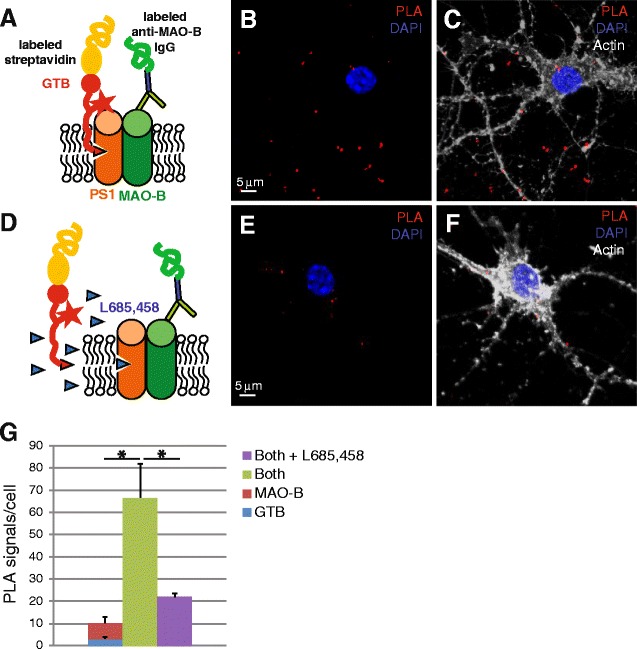
In-situ proximity ligation assay (PLA) in cultured neurons showing association between MAO-B and active γ-secretase. a Schematic drawing of the PLA used to study the association between active γ-secretase and MAO-B using GTB as a PLA probe. b Typical confocal image showing the PLA signals (red dots) representing the association between active γ-secretase and MAO-B and DAPI staining to visualize nuclei (blue). Scale bar, 5 μm for all four images. c Same image as in b but with phalloidin stain (gray) to visualize also the cell structure. d Schematic of the setup for competition of the PLA signal in the presence of excessive amounts of the free γ-secretase inhibitor L-685,458. A typical image of the PLA signals in the presence of competitor is shown without (e) and with (f) phalloidin stain. Quantification of the PLA signals was done using the Duolink image tool (g). Mean values ± SEM from quantifications of at least three cells from three different experiments are shown. Statistical significance was calculated with one-tailed, two-sample unequal variance t test. *p < 0.05 (Color figure online)
