Fig. 8.

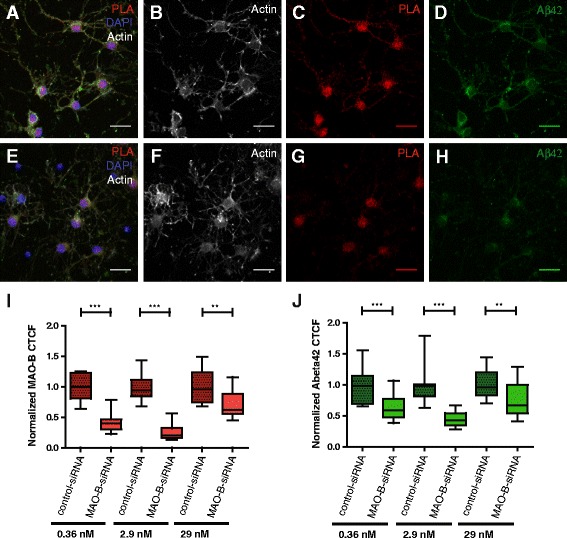
MAO-B silencing by siRNA transfection and its effect on intracellular Aβ42. The effect was investigated for three concentrations of control-siRNA/MAO-B siRNA2 (0.36, 2.9 and 29 nM). Localization of MAO-B staining by proximity ligation assay (PLA; red) in neurons, intracellular Aβ42 staining (green), DAPI nuclear staining (blue) and F-actin-binding TRITC-conjugated phalloidin (gray) is illustrated for both control-siRNA-treated (a) and MAO-B siRNA2-treated (e) cells. TRITC-conjugated phalloidin staining shows no significant alterations in neuronal structures after siRNA lipofection for both control-siRNA-treated (b) and MAO-B siRNA2-treated (f) cells. Representative images of MAO-B suppression by 2.9 nM MAO-B siRNA2 and the effect on intracellular Aβ42 levels in 8 DIV neurons (g, h) compared with the same concentration of control-siRNA-treated samples (c, d). MAO-B and Aβ42 fluorescence signals, quantified as normalized corrected total cell fluorescence (CTCF, see Methods), are shown in box plot graphs. Data from single cells in two different experiments is shown in Additional file 1: Figure S4. Normalized data are presented as mean values ± SEM. Significance was determined using two-tailed, two-sample unequal variance t test for the same concentrations of control-siRNA (normalized as value 1.0) and MAO-B siRNA2. The decreased protein level of MAO-B (red) in MAO-B siRNA transfected neurons compared to control-siRNA transfected neurons is shown (i). The effect of MAO-B silencing on intracellular Aβ42 levels (green) by MAO-B siRNA2 silencing compared with a control-siRNA-treated sample is illustrated in (j). Z-projections of maximum intensity images collected by Z-stack scanning at 0.54-μm intervals with a laser scanning confocal microscope (LSM 510 META; ZEISS) are shown, scale bar = 30 μm. **p < 0.01; ***p < 0.001. siRNA small interfering RNA
