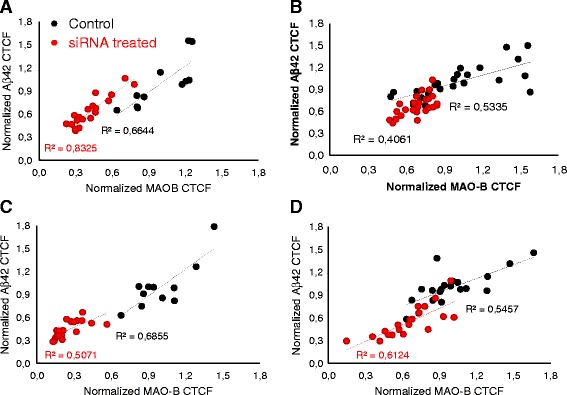
Fig. 9.

Correlation of Aβ42 and MAO-B cellular fluorescence in cortex neurons. Correlation plots of normalized MAO-B and Aβ42 CTCFs data of individual cells from MAO-B siRNA2-treated (red circles) and control- siRNA-treated (black circles) cultures from both transfection experiment I (a, c) and transfection experiment II (b, d). a, b 0.36 nM siRNA; c, d 2.9 nM siRNA. Coefficients of determination (R 2) data for each treatment group were calculated. Aβ amyloid β-peptide, CTCF corrected total cell fluorescence
