
Figure 2.
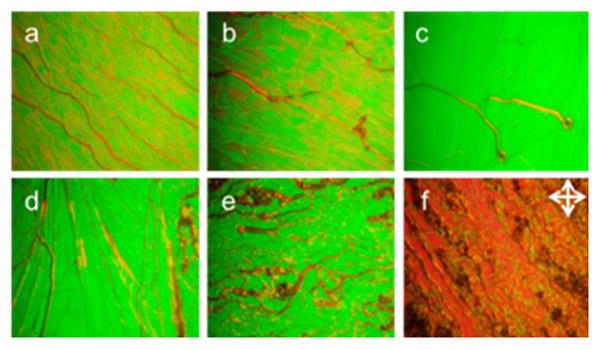
POM textures of DFCLC nanocomposites with different concentration of M-SiO2 nanoparticles at 0 wt% (a), 0.5 wt% (b), 1.0 wt% (c), 1.5 wt% (d), 2.0 wt% (e) and 3.0 wt% (f) at room temperature.
Official websites use .gov
A
.gov website belongs to an official
government organization in the United States.
Secure .gov websites use HTTPS
A lock (
) or https:// means you've safely
connected to the .gov website. Share sensitive
information only on official, secure websites.
POM textures of DFCLC nanocomposites with different concentration of M-SiO2 nanoparticles at 0 wt% (a), 0.5 wt% (b), 1.0 wt% (c), 1.5 wt% (d), 2.0 wt% (e) and 3.0 wt% (f) at room temperature.