
Figure 4.
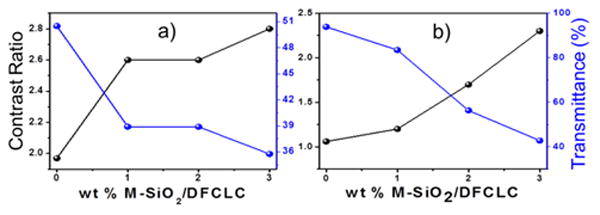
Contrast ratio (black) and transmittance (blue) curves of incident light (550 nm) with different concentrations of M-SiO2 nanoparticles in DFCLC at (a) focal conic state (30 kHz, 20V) and (b) planar state (70 kHz, 20V).
Official websites use .gov
A
.gov website belongs to an official
government organization in the United States.
Secure .gov websites use HTTPS
A lock (
) or https:// means you've safely
connected to the .gov website. Share sensitive
information only on official, secure websites.
Contrast ratio (black) and transmittance (blue) curves of incident light (550 nm) with different concentrations of M-SiO2 nanoparticles in DFCLC at (a) focal conic state (30 kHz, 20V) and (b) planar state (70 kHz, 20V).