
Figure 5.
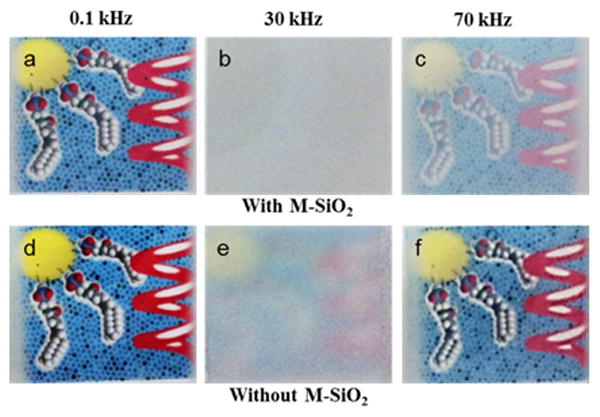
Photographs of a colorful image positioned behind the LC cells containing DFCLC with 2 wt% M-SiO2 (a, b, c) and without M-SiO2 (d, e, f) at 0.1 kHz, 30 kHz and 70 kHz respectively under an applied constant bias of 20 V.
Official websites use .gov
A
.gov website belongs to an official
government organization in the United States.
Secure .gov websites use HTTPS
A lock (
) or https:// means you've safely
connected to the .gov website. Share sensitive
information only on official, secure websites.
Photographs of a colorful image positioned behind the LC cells containing DFCLC with 2 wt% M-SiO2 (a, b, c) and without M-SiO2 (d, e, f) at 0.1 kHz, 30 kHz and 70 kHz respectively under an applied constant bias of 20 V.