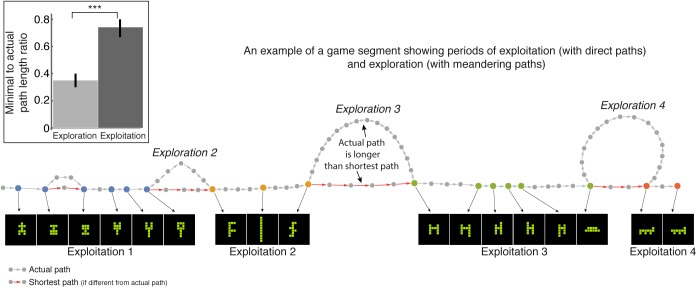
Fig 4. Participants follow optimal (shortest) paths in exploitation phases.
Shown are moves (circles), gallery-chosen shapes (colored circles), actual (gray) and minimal (red) paths (minimal path marked when different from actual path). Exploration and exploitation phases are labelled. Inset, players’ median ratio of minimal to actual path length between gallery shapes in exploitation and exploration.

