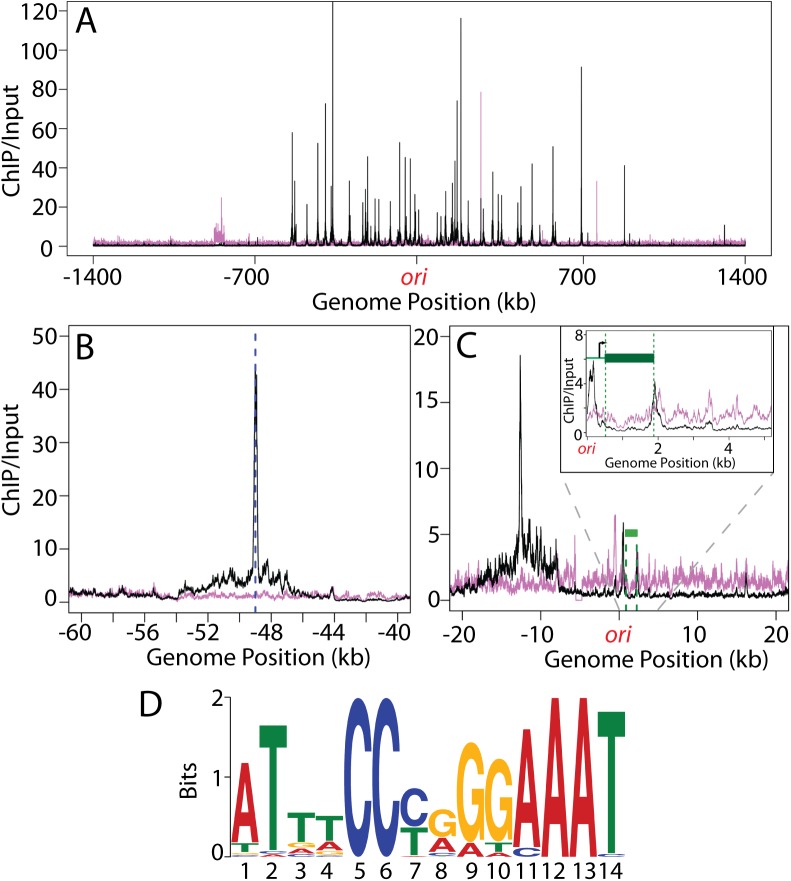
Fig 5. Identification of SaNoc binding sites.
(A) Shown are the ChIP-Seq profiles for HG003 (wt) (black) and a Δnoc derivative (magenta). The profiles were generated by normalizing the reads from ChIP-Seq samples (using anti-BsNoc antibodies) to those from input genomic DNA. The origin (ori) is at position 1 with positions on the left and right chromosome arms indicated as negative and positive numbers, respectively. (B) Close-up view of a region bound by Noc with the peak indicated by a dotted blue line. Note the extended spread of the peak base compared to the background signal from the Δnoc sample. (C) Close-up view of the origin region including a minor Noc binding site adjacent to the dnaA gene (green bar). The location and direction of the dnaA transcription start site are indicated by the black arrow in the inset. (D) Sequence logo of the SaNoc consensus binding site generated using the 41 major enrichment peaks (S7 Table) identified in the ChIP-Seq analysis.

