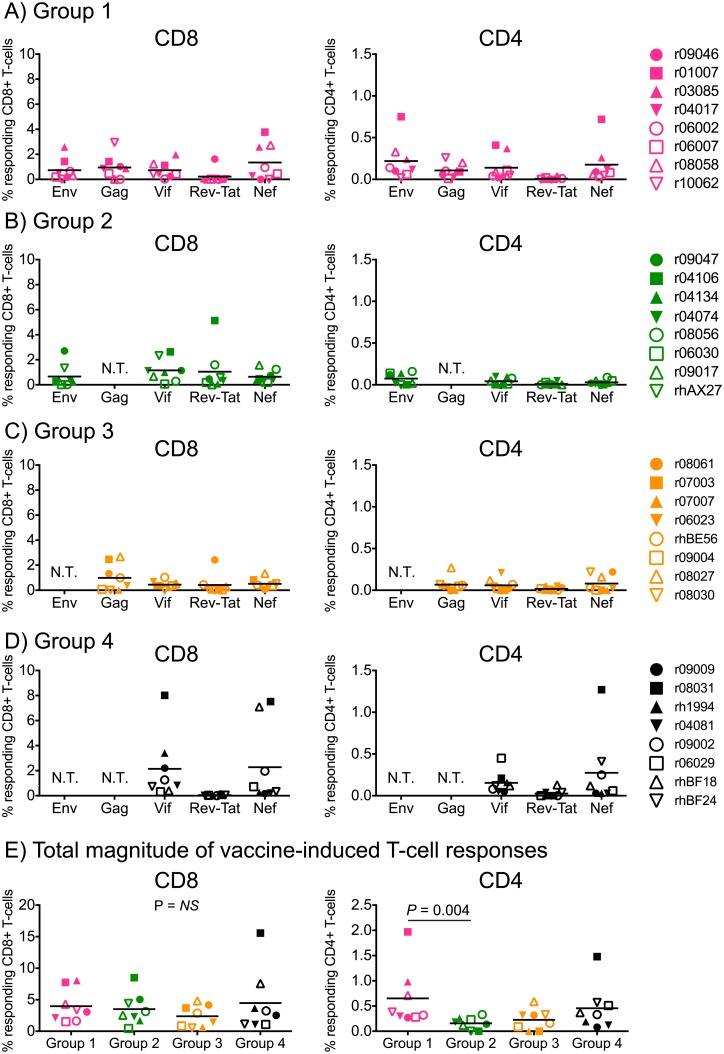
Fig 3. ICS analysis of vaccine-induced T-cell responses in Groups 1–4 at the time of SIV challenge.
CD8+ and CD4+ T-cell responses were measured in PBMC by ICS using pools of peptides (15mers overlapping by 11 aa) spanning the appropriate SIVmac239 proteins. Peptides spanning the Rev and Tat proteins were tested together in the same in tubes. The percentages of responding CD4+ or CD8+ T-cells displayed in all panels were calculated by adding the frequencies of positive responses producing any combination of three immunological functions (IFN-γ, TNF-α, and CD107a). The magnitude and specificity of vaccine-induced CD8+ and CD4+ T-cell responses are shown for Group 1 (A), Group 2 (B), Group 3 (C), and Group 4 (D). The Kruskal-Wallis test was used for these comparisons and no difference was detected for CD8+ T-cell responses (P = 0.63). A significant difference in CD4+ T-cell responses was detected by this approach (P = 0.03), which was subsequently investigated by pairwise comparisons using the Mann-Whitney test. This statistically significant difference stemmed from higher levels of SIV-specific CD4+ T-cells in Group 1 compared to Group 2 (P = 0.004). Groups 1, 2, 3, and 4 are color coded in pink, green, beige, and black, respectively. Lines represent medians, and each symbol corresponds to one vaccinee. N.T., not tested.

