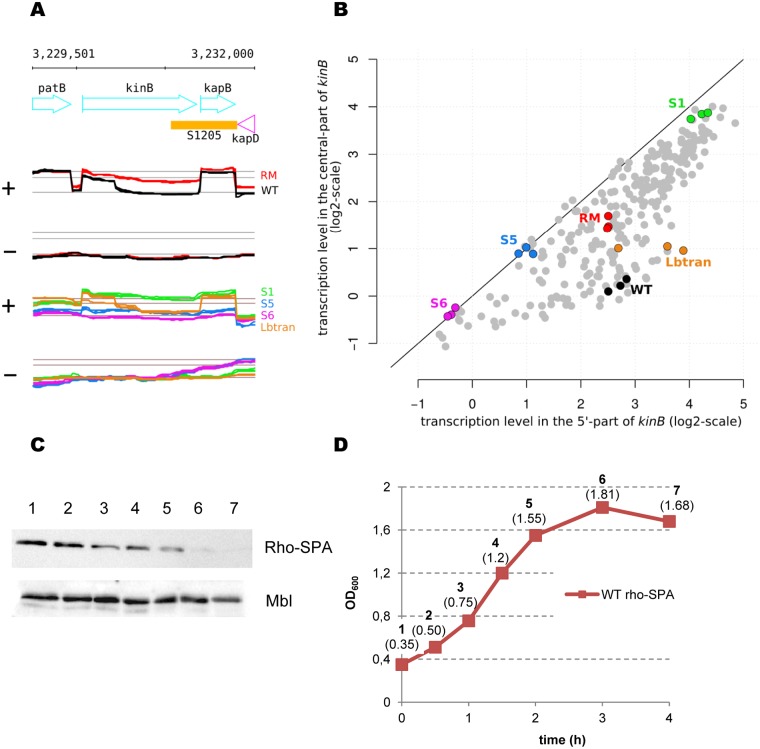
Fig 9. Rho-mediated control of kinB transcription is removed during sporulation.
(A) The kinB gene is expressed differently during sporulation. Top and middle panels: Annotated genome and transcriptional profiles of kinB gene on the coding (+) and uncoding (−) strands in WT (black) and RM (red) cells during exponential growth in LB medium. Bottom panels: Transcriptional profiles of kinB gene in WT cells during transition phase (LBtran, orange), early (S1, green) and late (S5, blue and S6, pink) sporulation stages at both strands. The only normalization applied to the LBtran, S1, S5, and S6 profiles consisted in subtracting the chromosome median, whereas the RM and WT were subjected to the normalization procedure described in the Matherials and Methods section. The expression profiles are from [17] and include three biological replicas. (B) Comparison of expression levels between the 5’- and central parts of kinB gene across B. subtilis growth conditions represented by 269 re-annotated RNA samples collected for the wild-type [17]. The highlighted points correspond to the WT profiles shown in panel (A): LBtran (orange), S1 (green), S5 (blue), S6 (pink); and RM (red) and WT (black) during exponential growth in LB. Detailed values are provided in S5 Table. (C and D) Intracellular levels of Rho decrease during sporulation. B. subtilis BSB1 WT cells containing rho-SPA translational fusion at natural chromosomal locus were grown in sporulation- inducing DS medium at 37°C. Samples were taken at the indicated OD600 (D) and analyzed for Rho-SPA protein (C) as described in Materials and Methods. The three last samples (5 to 7) were taken from the sporulating cultures with a one-hour interval. To control equilibrium between the samples established by the Bradford analysis, total protein extracts were analyzed for Mbl protein using anti-Mbl specific antibodies. The experiment was reproduced three times. The results from the representative experiment are presented.

