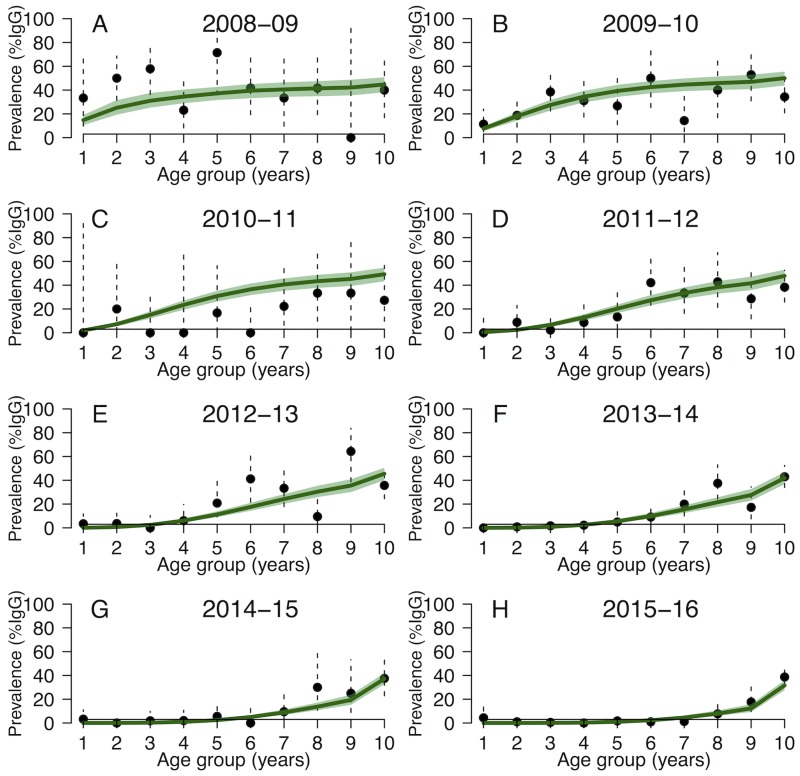
Fig 3. (A-H) Model fit of the exponential model (Model 1b) for (A-H) each epidemiological year between July 2008 and June 2016: Median (green line) and 95% CrI (green shaded area).
The black dots are the observed annual age-stratified IgG prevalence (vertical dashed lines are the 95% CI).

