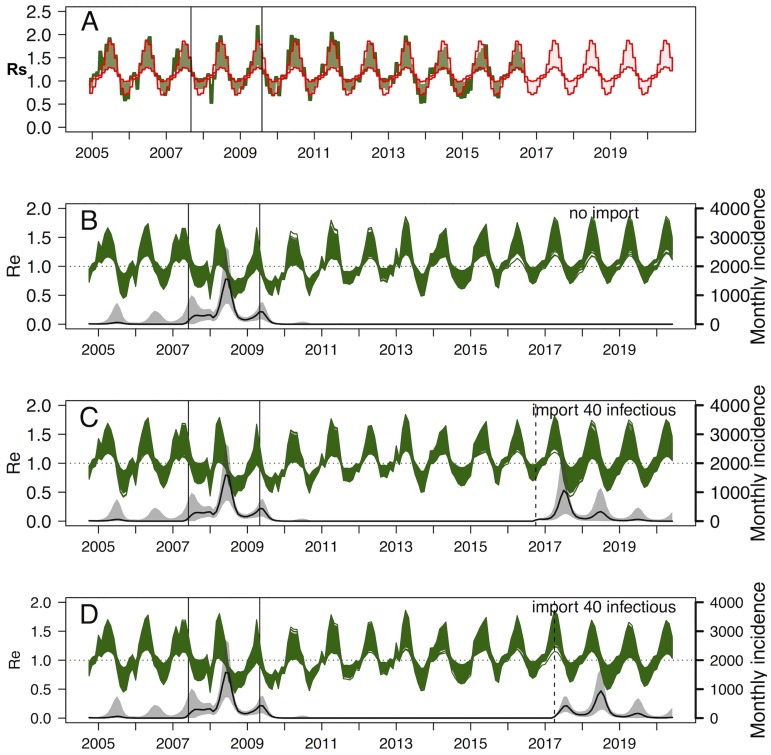
Fig 4.
(A-D) Exponential model (Model 1b), (A) Seasonal variation of Rst (green area), reflecting the actual NDVI values and variation of Rst using long-term NDVI average values (red area). The period between the two vertical lines is the estimated import window. (B-D): Results of the stochastic forecasts: (B) Forecast 1: Effective reproduction number Re over time (green lines, Rst*proportion of susceptibles), and RVF incidence (solid black line) expressed as the number of newly infectious animals per month, together with their 95%CrI (grey shaded area), without import of infectious animals in 2016–17. (C) Forecast 6: with the import of 40 infectious animals in Oct 2016. (D) Forecast 11: with the import of 40 infectious animals in April 2017.

