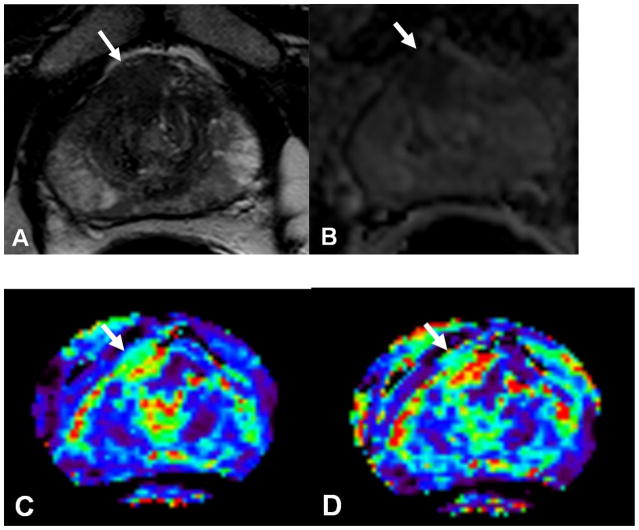
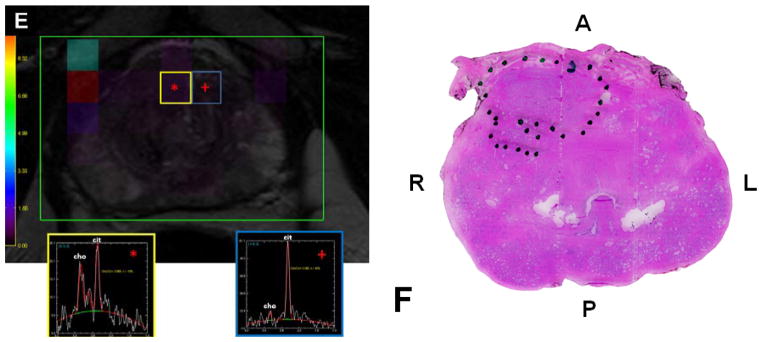
Figure 3.
Prostate cancer in 52-year-old man. (a) Axial T2-weighted and ADC map of diffusion weighted (b) MR images demonstrate a low-signal-intensity lesion (arrow) in right mid anterior central gland lesion suspicious for cancer. Ktrans (c) and kep (d) maps of dynamic contrast enhanced MRI localize tumor (arrow). MR spectroscopy (e) demonstrates increased ratio of choline (cho) to citrate (cit) in the right mid anterior central gland lesion (*) when compared with normal adjacent left side (+). Histopathologic slide (f) at mid prostate level confirms presence of tumor (Gleason score, 7) (black dotted line) detected on multi-parametric MRI (A = anterior, L = left, P = posterior, R = right).


