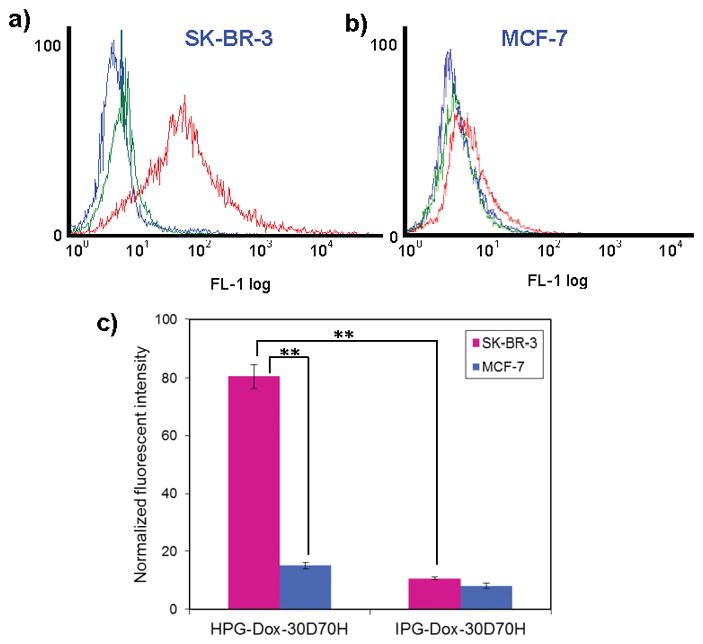
Figure 3.

Flow cytometry analysis of a) SK-BR-3 and b) MCF-7 cells treated with HPG-Dox-30D70H or IPG-Dox-30D70H. Blue, green, and red curves represent non-treated, IPG-Dox-30D70H treated, and HPG-Dox-30D70H treated samples, respectively. c) Normalized fluorescent intensities using flow cytometry. The error is the standard deviation from the mean, where n = 3. ** is P < 0.001.
