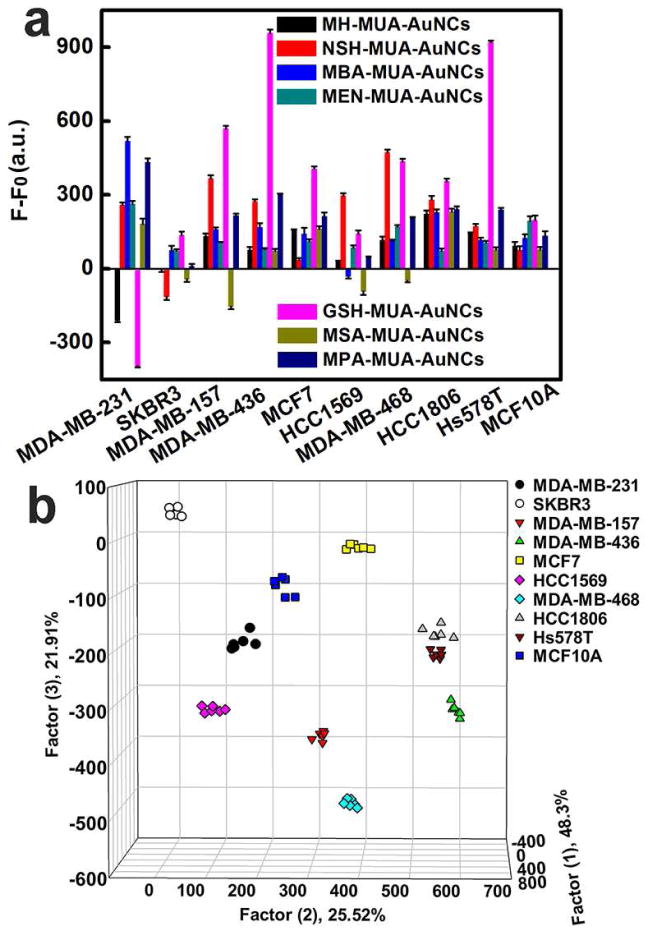
Fig. 2.
Breast cell identification with the fluorescent AuNCs based sensing platform. (a) Fluorescence response patterns of AuNCs against various cells (1000 cells): MDA-MB-231, SKBR3, MDA-MB-157, MDA-MB-436, MCF7, HCC1569, MDA-MB-468, HCC1806, Hs578T and MCF10A cells. Error bars represent standard deviations of six parallel measurements. F−F0 represents the fluorescence intensity change of AuNCs before and after addition of cells, where F0 represents original fluorescent intensity of AuNCs while F represents fluorescent intensity of AuNCs with different breast cells. (b) Canonical score plot for the fluorescent AuNCs sensor array. All ten cells were well separated and properly identified.

