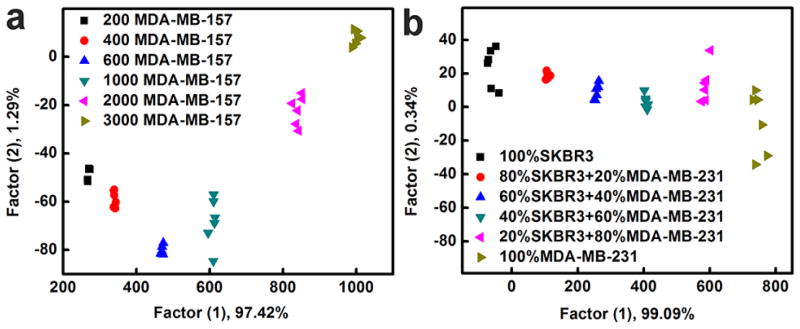
Fig. 4.
(a) Identification of cells at various concentrations using the fluorescent AuNCs based sensor array. Canonical score plot for fluorescence response patterns against different amounts of MDA-MB-157 cells (200, 400, 600, 1000, 2000 and 3000 cells). (b) Canonical score plot against cell mixtures, including pure SKBR3 cells; 80% SKBR3 + 20% MDA-MB-231; 60% SKBR3 + 40% MDA-MB-231; 40% SKBR3 + 60% MDA-MB-231; 20% SKBR3 + 80% MDA-MB-231; pure MDA-MB-231 cells. In each case, the total cell amount was 1000 cells.

