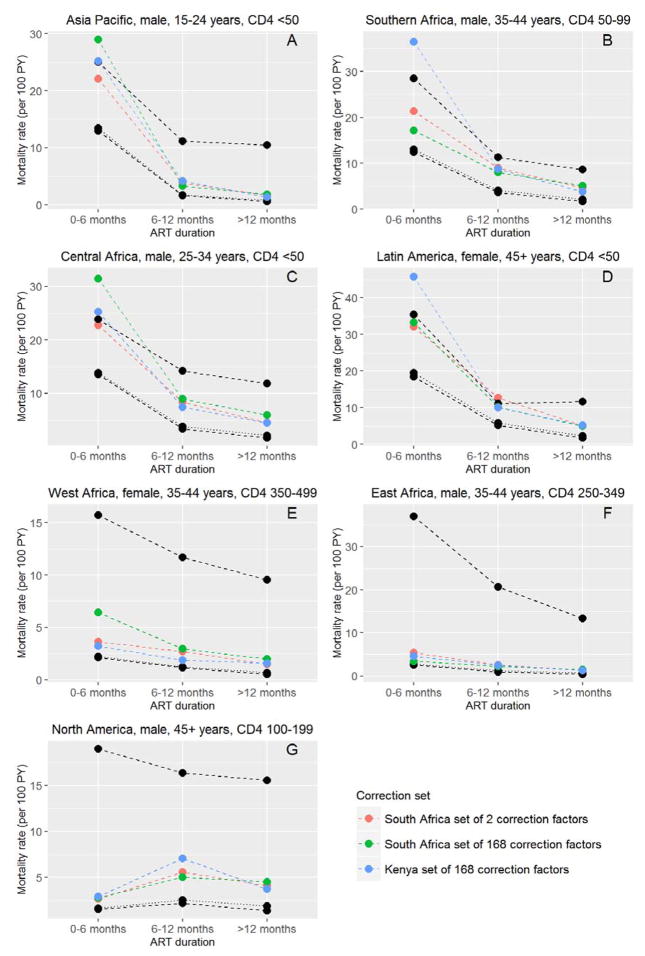
Figure 2.
Examples of sensitivity analyses for Asia Pacific (A), Southern Africa (B), Central Africa (C), Latin America (D), West Africa (E), East Africa (F) and North America (G). The different corrected mortality estimates are compared with worst-case scenario estimates (upper black dashed line) and best-case scenario estimates (lower black dashed line) and crude mortality (black dotted line). Crude mortality and mortality from best-case scenario are closely similar.

