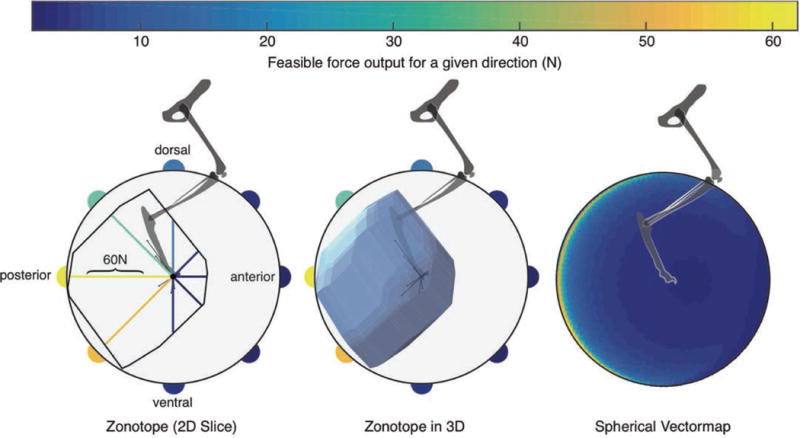
Figure 2.

Left: The polygon of the 2-D feasible force set in the sagittal plane. The color-coded vectormapping of radial lines indicate the magnitude of the maximal feasible force along that direction, then vectormapped onto the perimeter of the circle surrounding the FFS. The very thin lines emanating from the origin are the lines of action of each of the 31 muscles. Center: the polyhedron of the 3-D FFS, again with the vectormapping of force magnitude values onto a circle in the sagittal plane. Right: The color-coded vectormapping onto the surface of a sphere indicating the maximal feasible force in every direction in 3-D. Note the FFS is rather flat on the sagittal plane, but elongated towards the posterior direction. All data are for the cat called Birdy in [2]. For 3-D views see [[[add Elsevier URL]]].
