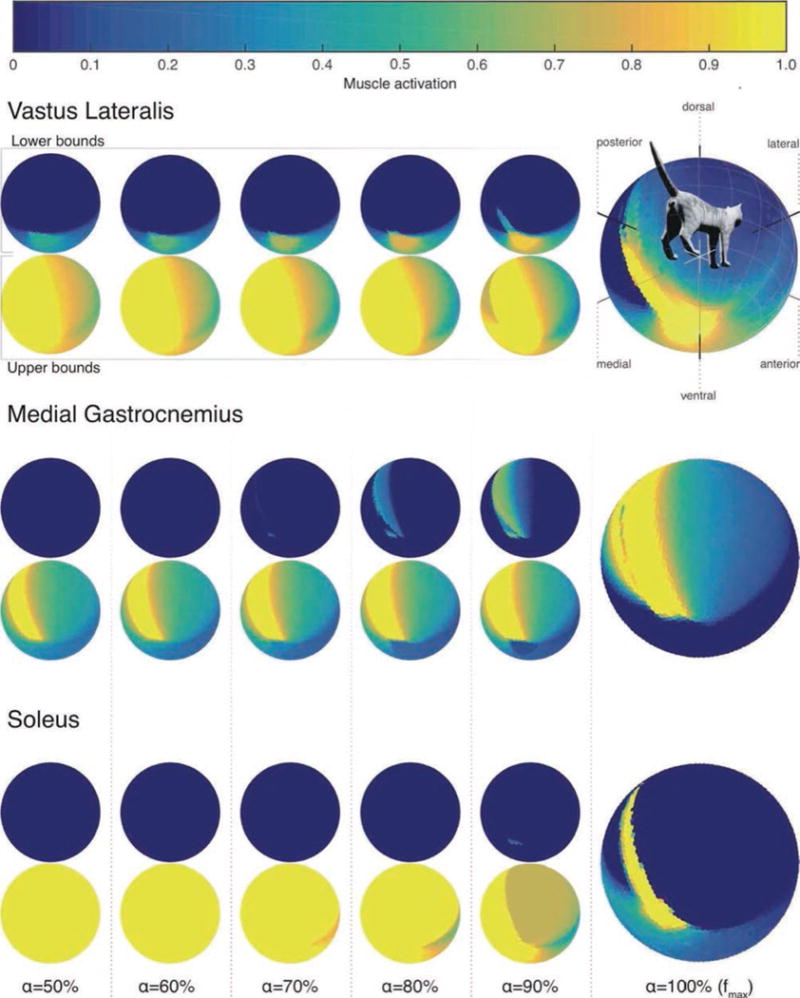
Figure 4.

Structure of the feasible activation set for three muscles. The large vectormaps on the far Right show their unique activation level for maximal force output in every 3-D direction. Because multiple activation levels can produce submaximal forces, the small vectormaps to the Left show the lower and upper bounds of those feasible activation levels for force magnitudes (a) gradually increasing from 50% of maximal in every 3-D
