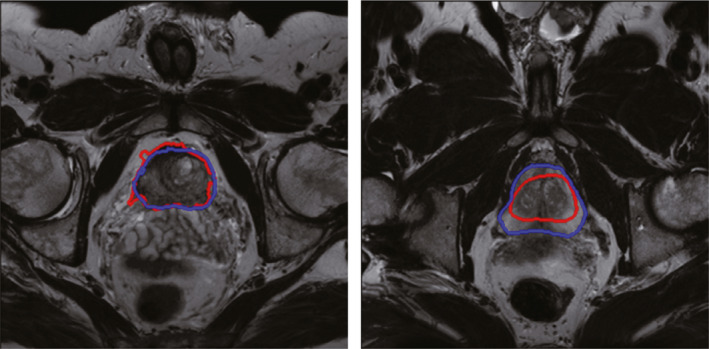
Figure 1.

Limitations of the graph cut method and the active contour model‐based method for prostate segmentation. Blue curve is the ground truth from manual segmentation by a radiologist, while the red curves are the segmented contours by the computer algorithms. Left figure is the segmentation result obtained by graph cuts, while the right figure is the segmentation result obtained by active contour model. The graph cut method tends to leak at the location with low image contrast, while the active contour model‐based method may fall at local minima based on an inaccurate initialization. [Color figure can be viewed at wileyonlinelibrary.com]
