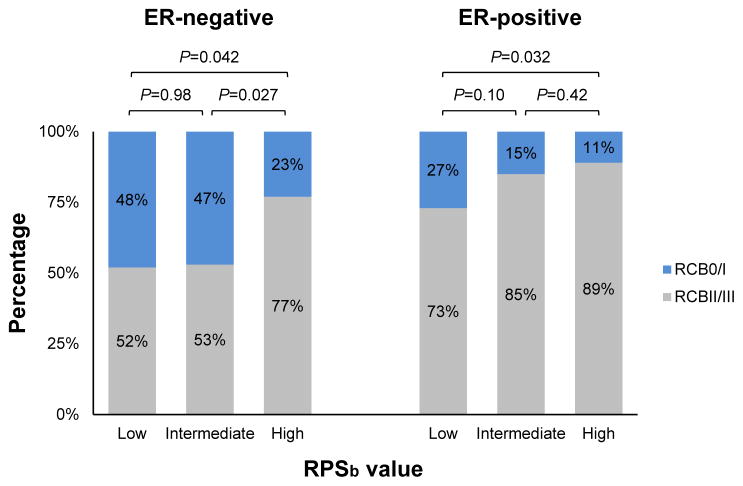
Figure 2. RPS predicts residual cancer burden following neoadjuvant chemotherapy in breast cancer.
RCB-0/I=pathologic complete response (pCR)/minimal residual disease; RCB-II/III=moderate/extensive residual disease. Low, intermediate and high RPS values denote the lowest 25th, middle 50th, and highest 25th RPS percentiles. P-values were determined using Chi-Square tests between groups.

