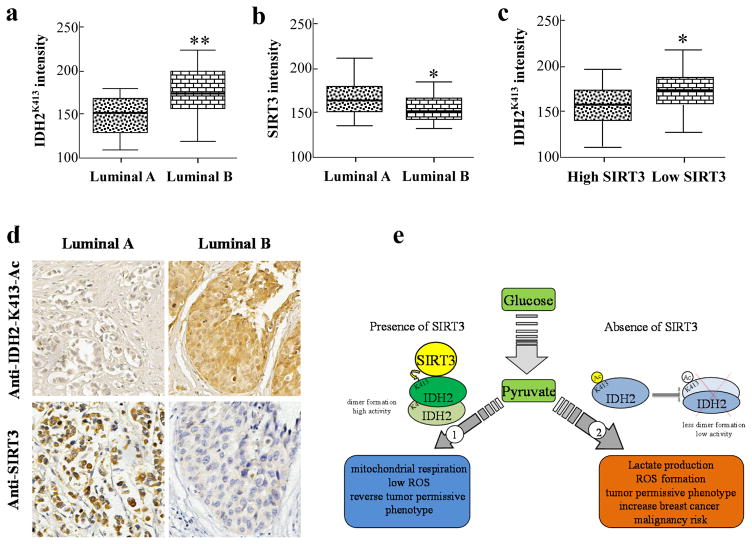
Figure 5. IDH2-K413-Ac is correlated with breast cancer risk.
(a–b) Slides containing Luminal A (n=17) or Luminal B (n=38) patient samples (Biomax) were stained using anti-IDH2-K413-Ac and anti-SIRT3 antibody. (c) Samples were separated into high SIRT3 (n=25) and low SIRT3 (n=30) groups, and IDH2K413 levels. (d) A representative image demonstrating IDH2K413 and SIRT3 staining in Luminal A and Luminal B cancer samples. (e) Summarized mechanism. The shaded boxes represent the interquartile range; whiskers represent min and max; bars represent the median. * indicates p<0.05, ** indicates p<0.01 by two-tailed unpaired t-test using Prism 6.0.

