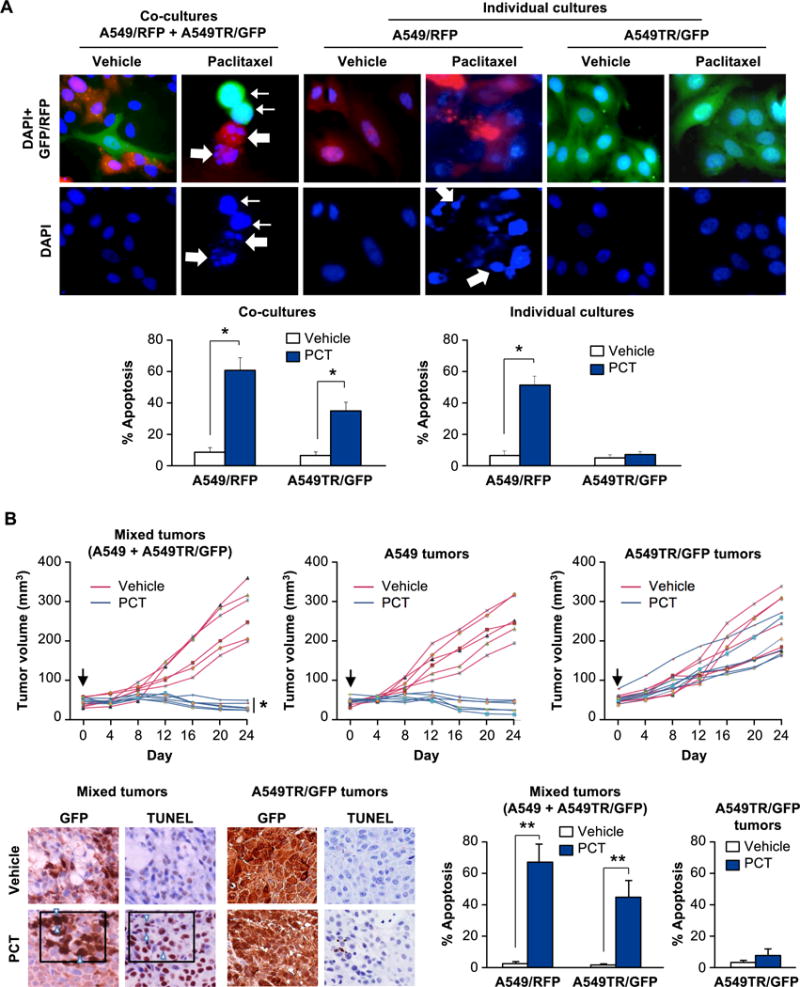
Figure 1. Paclitaxel treatment of heterogeneous cultures induces apoptosis in both sensitive and resistant cells.

(A) Paclitaxel induces apoptosis in Paclitaxel-resistant cells A549TR/GFP co-cultured with Paclitaxel-sensitive cells A549/RFP. Cells were grown separately (as individual cultures, upper middle and right panels) or co-cultured as a 1:1 mixture (1 × 10⁶ each) (upper left panel), and treated with Paclitaxel (PCT, 25 nM) or vehicle for 24 h. The cells were then stained with DAPI to reveal their nuclei (upper panels). Apoptotic cells were quantified (lower panels) as indicated in Supplemental Materials and Methods section. Three independent experiments were carried out, and the results in the graphs represent mean ± SD from three independent experiments. Asterisk (*) indicates statistical significance (P < 0.001) based on Student’s t test. A549/RFP cells (thick arrows) and A549TR/GFP cells (thin arrows) underwent apoptosis when treated with Paclitaxel in co-cultures.
(B) Paclitaxel induces apoptosis in Paclitaxel-resistant cells within tumors containing Paclitaxel-sensitive cells. A549 cells or A549TR/GFP cells were injected separately (upper middle and upper right panels) or co-injected as a 1:1 mixture (1.5 × 10⁶ cells of each) (upper left panel) into the flanks of nude mice. When the tumors had grown to a volume of approximately 50 mm3 (Day 0, black arrow), the mice were injected i.p. with Paclitaxel (PCT) or vehicle. Six mice were used for each treatment group and tumor volumes for each mouse over a 24-day period are shown. Asterisk (*) indicates that the mixed tumors treated with PCT were significantly smaller in volume (P < 0.025 by Student’s t test) compared to A549TR/GFP tumors treated with PCT.
Sections of the mixed tumors or A549TR-tumors were scored for GFP expression or apoptosis by TUNEL assays (lower left panels). Data show percentage of GFP-positive cells that were also TUNEL-positive in three different tumors, and mean ± SD values are presented. Arrowheads indicate representative GFP-positive cells that are also TUNEL-positive. Asterisks (**) indicate statistical significance (P < 0.001) based on Student’s t test.
