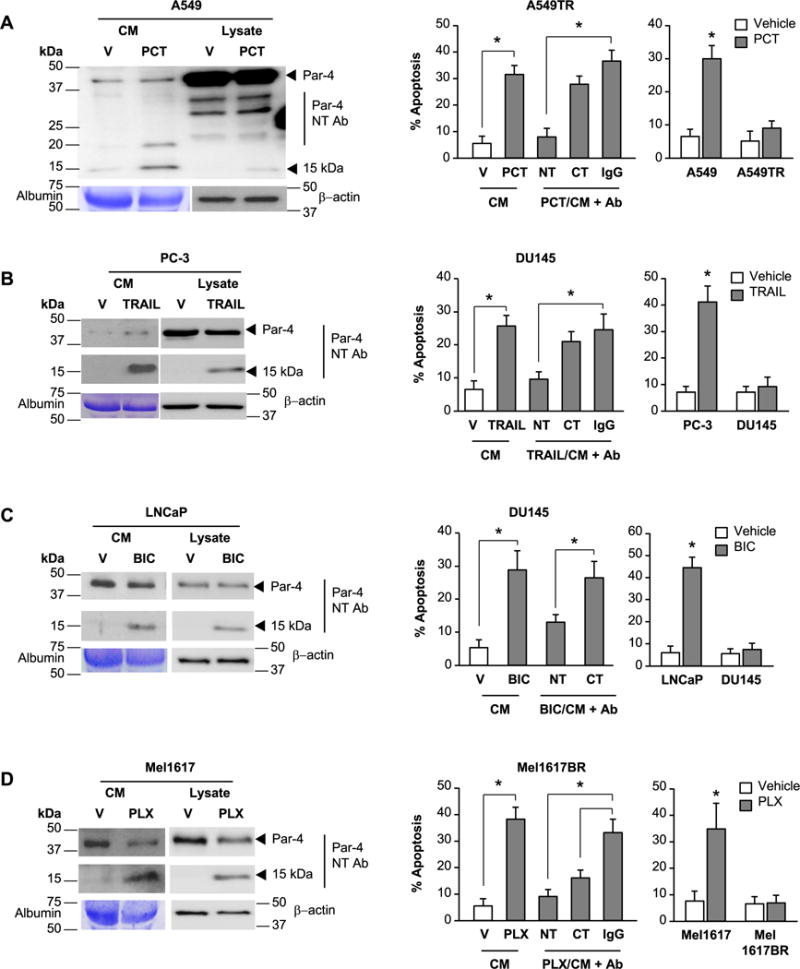
Figure 2. The 15 kDa amino-terminal fragment of Par-4 is involved in paracrine apoptosis of therapy-resistant cancer cells.

(A) Paracrine apoptosis of Paclitaxel-resistant A549TR cells. A549 cells were treated for 24 h with vehicle (V) or Paclitaxel (PCT, 25 nM). The CM from the vehicle- or PCT-treated cells was then pre-incubated with Par-4 N-terminal (NT) or C-terminal (CT) antibody (Ab) or control IgG, and then applied to the PCT-resistant A549TR cells for 24 h (middle panel). As controls, the A549 or A549TR cells were directly treated with vehicle (V) or PCT for 24 h (right panel).
(B) Paracrine apoptosis of TRAIL-resistant DU145 cells. PC-3 cells were treated for 24 h with vehicle (V) or TRAIL (100 ng/ml). The CM from the vehicle- or TRAIL-treated cells was pre-incubated with Par-4 (NT) or (CT) antibody or control IgG, and then applied to the TRAIL-resistant DU145 cells for 24 h (middle panel). As controls, PC-3 and DU145 cells were directly treated with vehicle (V) or TRAIL (100 ng/ml) for 24 h (right panel).
(C) Paracrine apoptosis of bicalutamide-resistant DU145 cells. LNCaP cells were treated for 24 h with vehicle (V) or bicalutamide (BIC, 70 μM). The CM from the vehicle- or BIC-treated cells was pre-incubated with Par-4 (NT) or (CT) antibody or control IgG, and then applied to the BIC-resistant DU145 cells for 24 h (middle panel). As controls, LNCaP and DU145 cells were directly treated with vehicle (V) or BIC (70 μg/ml) for 24 h (right panel).
(D) Paracrine apoptosis of PLX4720-resistant Mel1617BR cells. Mel1617 cells were treated for 24 h with vehicle (V) or PLX4720 (PLX, 2.5 μM). The CM from the vehicle- or PLX4720-treated Mel1617 cells was pre-incubated with Par-4 (NT) or (CT) antibody or control IgG, and then applied to the PLX472–resistant Mel1617BR cells for 24 h (middle panel). As controls, Mel1617 and Mel1617BR cells were directly treated with vehicle (V) or PLX4720 (2.5 μM) (right panel).
(A–D) Western blot analysis was performed on the whole-cell lysates and CM with the indicated antibodies (left panels). Uncut gels are shown in Supplementary Figure S2 A–D. The cells were scored for apoptosis by ICC for active caspase 3 (middle and right panels). Three independent experiments were carried out, and the apoptosis data represent mean ± SD from three independent experiments. Asterisk (*) indicates statistical significance (P < 0.001) based on Student’s t test.
