
Figure 3.
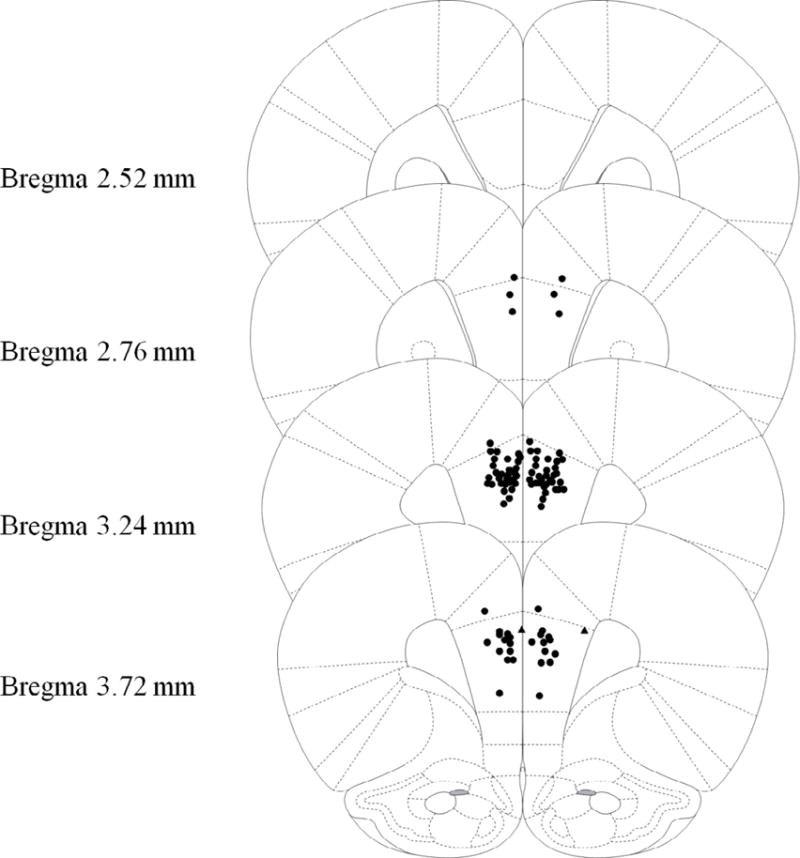
Schematic representation of injection cannula tip placement in the mPFC for Experiment 2. Animals included in final analyses are represented by filled black circle while animals excluded as mPFC placement misses are filled black triangle. Extremely anterior (Bregma 4.68mm or more) or posterior (Bregma 2.28 or less) were automatically excluded and are not represented in the following figure. Coronal brain images are adapted from the rat brain atlas of Paxinos and Watson (2007).