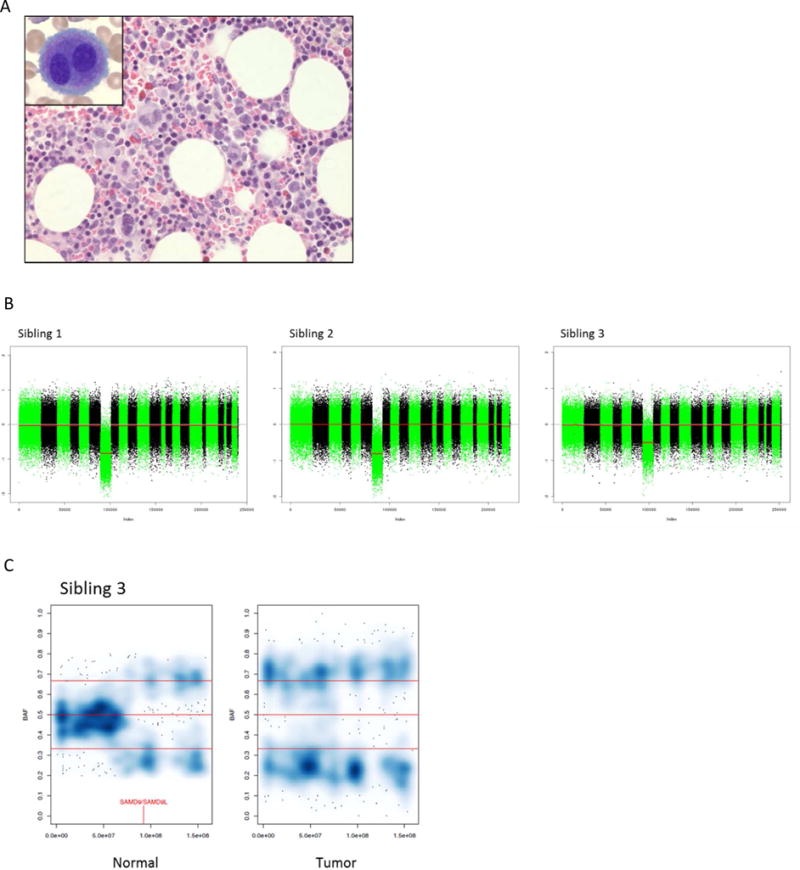
Figure 1. Diagnostic work up of 3 siblings with MDS and monosomy 7.

A.) Bone marrow core biopsy and aspirate (inset) showing dysplastic megakaryocytes in Sibling 1. B.) Copy number analysis demonstrating monosomy 7 in myeloid cells all three siblings. C.) Smoothed color density plots of chromosome 7 B-allele frequency (BAF) of lymphocyte (normal) and myeloid (tumor) DNA in Sibling 3 showing a subclonal population with allelic imbalance, despite the lack of a copy number change, consistent with CN-LOH in the lymphocytes. Darker blue signifies a higher data point (SNP alternative allele frequencies) density. Red vertical line indicates genomic location of SAMD9 and SAMD9L.
