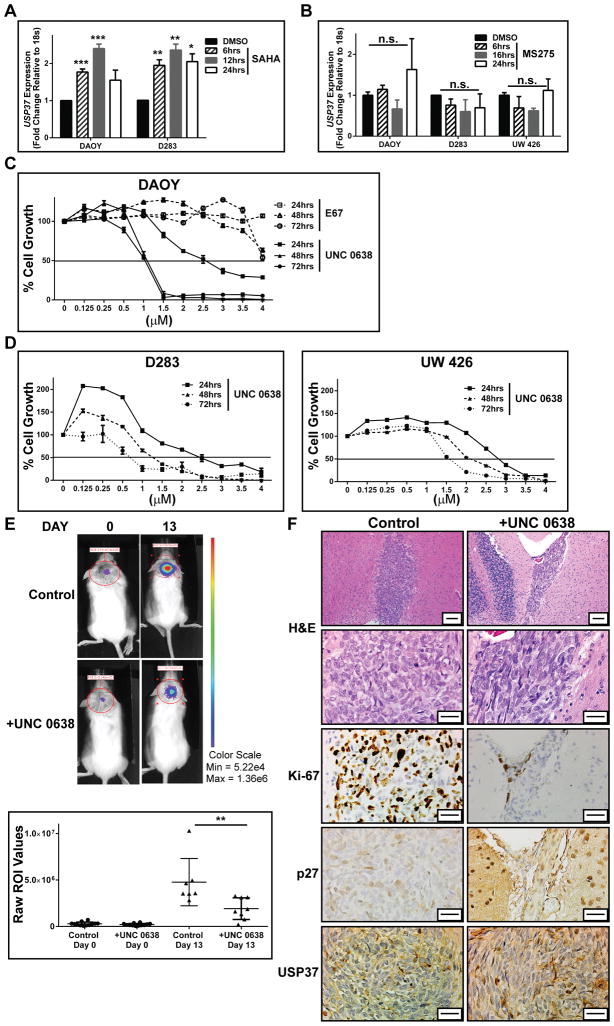
Figure 2. REST regulates USP37 expression through H3K9 methylation.
A. DAOY and D283 cells were treated with 5 μmol/L SAHA (Vorinostat) and B. DAOY, D283 and UW426 cells were treated with 2.5 μmol/L MS-275 (Entinostat) or vehicle (DMSO) for various times followed by Q-RT-PCR analyses to measure changes in USP37 gene expression in drug-treated cells compared to untreated cells. C. MTT assays were used to measure the effect of G9a inhibitors E67 and UNC 0638 on mitochondrial activity and cell growth. Solid black line indicates the IC50 value, which is also tabulated. D. D283 and UW426 cells were treated with UNC 0638 as described in C. and MTT assays were performed to obtain IC50 values indicated by dotted line. E. DAOY cells stably expressing firefly luciferase were pre-treated with 1.1 μM (IC50 at 48 hrs) for 12 hrs and implanted into NSG mice cerebella. Tumor growth was measured by BLI on the day of injection (day 0) and every 4 days thereafter. BLI on Days 0 and 13 of representative animals receiving drug-treated (+UNC 0638) and untreated cells (control) is shown (top). Relative flux for the cohort receiving control and drug-treated cells is shown in the bottom graph. F. Representative sections obtained from control and UNC 0638-treated cerebellar sections were processed for H&E staining and IHC with antibodies as indicated. Scale bars = 50 μm (top) and 20 μm (bottom). (*=p<0.05, **=p<0.01 and ***p=<0.001, n.s., not significant)

