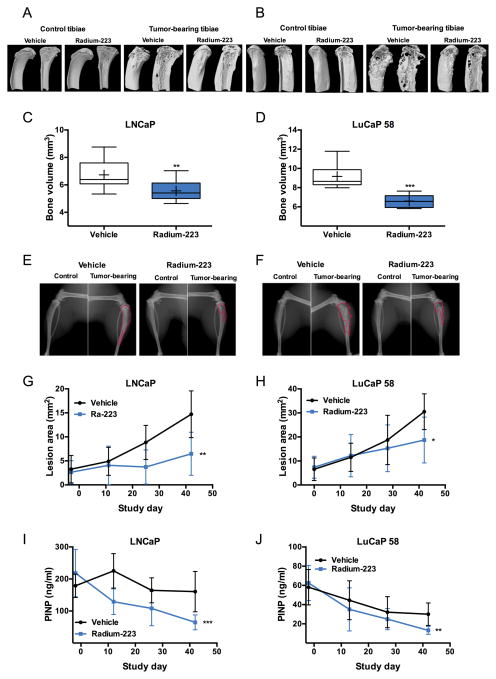
Figure 2. Radium-223 inhibits tumor-induced osteoblastic reaction resulting from LNCaP and LuCaP 58 prostate cancer growth in bone in mice.
A–B, Representative micro-CT reconstructions of healthy and tumor-bearing tibias in (A) LNCaP and (B) LuCaP 58 models imaged from the medial side (measurement area starting 0.5 mm below the growth plate). Respective sagittal sections are shown on the right. Bone volume of tibias in mice bearing C, LNCaP (n = 12–13, p = 0.00450) or D, LuCaP 58 (n = 8–10, p < 0.001) tumors. In box plots, horizontal lines show 5th, 25th, 50th, 75th and 95th centiles and crosses indicate mean values. Representative radiographs of healthy and tumor-bearing tibias in (E) LNCaP and (F) LuCaP 58 models. Red line delineates the osteoblastic/osteolytic/mixed lesion area. Osteoblastic/mixed lesion area measured biweekly during dosing in mice bearing (G) LNCaP tumors (mean ± SD, n = 13, p = 0.00366) and (H) LuCaP 58 tumors (mean ± SD, n = 11–17, p = 0.01702). I, PINP levels in mice bearing LNCaP tumors were measured biweekly (mean ± SD, n = 13, p<0.001). J, PINP levels in mice bearing LuCaP 58 tumors were measured biweekly (mean ± SD, n = 11–15, p = 0.00548). * p<0.05, ** p<0.01, *** p<0.001.

