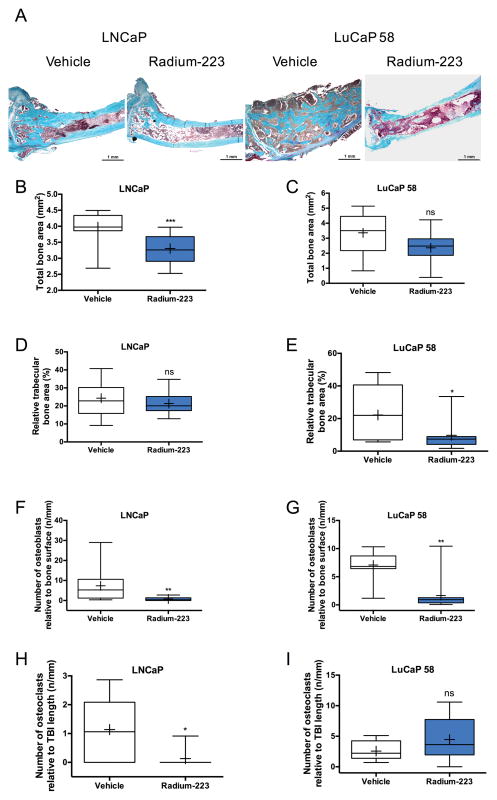
Figure 3. Radium-223 suppresses pathological bone formation in LNCaP and LuCaP 58 models of prostate cancer growth in mice.
A, Representative MGT staining of bone architecture and tumor area in LNCaP and LuCaP 58 tumor-bearing mice treated with vehicle or Radium-223 (300 kBq/kg, i.v.). Turquoise indicates bone, pale pink tumor and dark pink bone marrow. Scale bar = 1 mm; 25x magnification. B, Total bone area in mice bearing LNCaP tumors (n = 12–13, p = 0.00059). C, Total bone area in mice bearing LuCaP 58 tumors (n = 11, p = 0.05883). D, Trabecular bone area relative to bone marrow area in mice bearing LNCaP tumors (n = 12–13, p = 0.43710). E, Trabecular bone area relative to bone marrow area in mice bearing LuCaP 58 tumors. (n = 11, p = 0.0212). F, The number of osteoblasts relative to bone surface in mice bearing LNCaP tumors (n = 12–13, p = 0.00127). G, The number of osteoblasts relative to bone surface in mice bearing LuCaP 58 tumors (n = 11, p = 0.0014). H, The number of osteoclasts relative to tumor-bone interface (TBI) in mice bearing LNCaP tumors (n = 6–10, p = 0.01207). I, The number of osteoclasts relative to TBI in mice bearing LuCaP 58 tumors (p = 8–11, 0.19644). In box plots, horizontal lines show 5th, 25th, 50th, 75th and 95th centiles and crosses indicate mean values. ns = not significant,* p<0.05, ** p<0.01, *** p<0.001.

