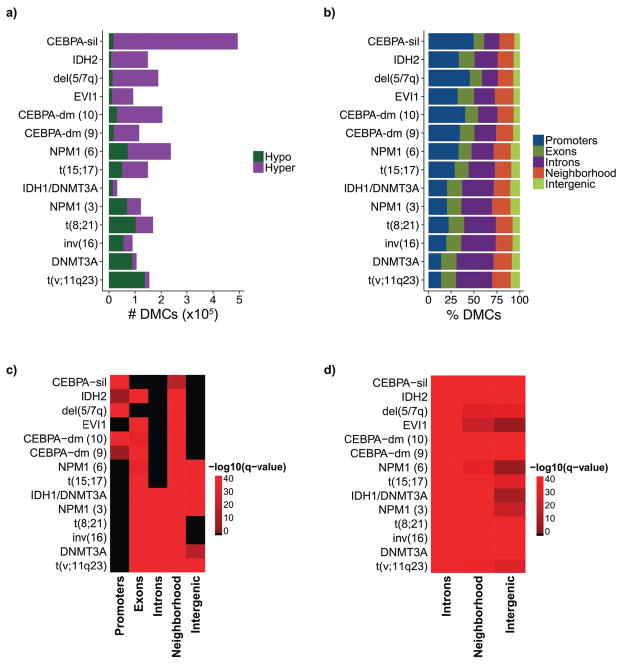
Figure 3. Genomic distribution of differential methylation relative to CD34+ controls.
A: Bar plots illustrating the overall number of hyper and hypomethylated CpGs for each cluster sorted from highest to lowest percentage of hypermethylated CpGs relative to CD34+ controls. B: Stacking bar plots illustrating the proportional distribution of differentially methylated CpGs in each genomic compartment. C: Heatmap illustrating the enrichment of differentially methylated CpGs in each genomic compartment. D: Heatmap illustrating the enrichment of differentially methylated CpGs within HSPC enhancers in different genomic compartments.

