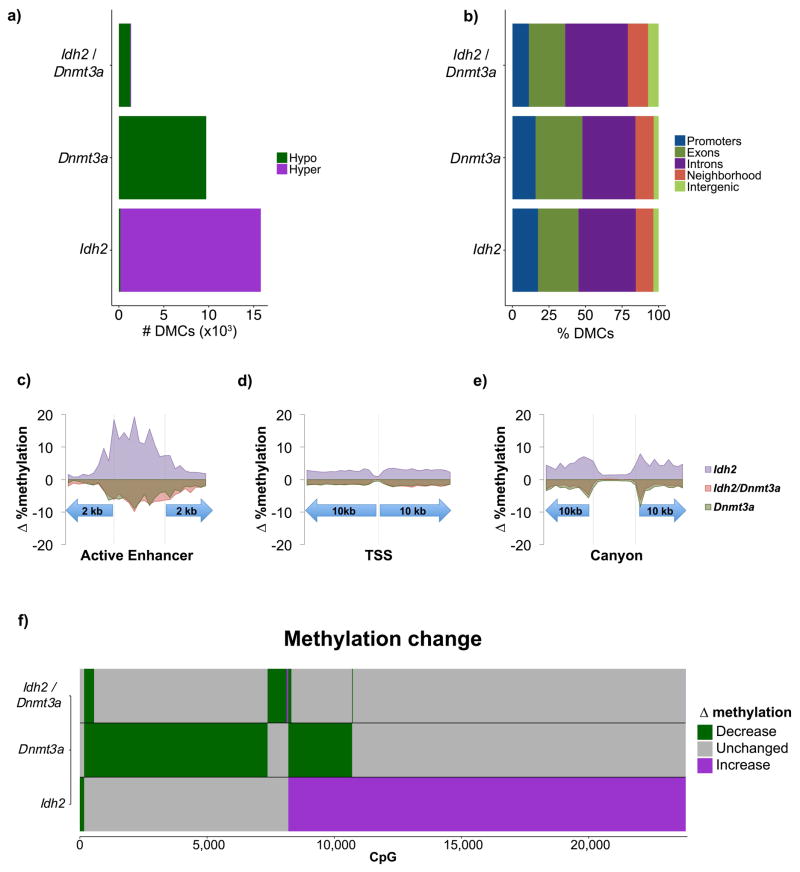
Figure 5. Mouse model of IDH2, DNMT3A, and IDH2/DNMT3A AMLs.
A: Number of differentially methylated CpGs within Idh2R140Q, Dnmt3AR878H, and Idh2R140Q/Dnmt3AR878H mutant cohorts compared to normal LSK controls. B–D: Average overall methylation change in each cohort relative to normal controls within active enhancers, promoters, and canyons. E: Bar plots illustrating the type of methylation change relative to normal LSK controls in Idh2R140Q, Dnmt3AR878H, and Idh2R140Q/Dnmt3AR878H cohorts. F: Bar plots illustrating the type of methylation change relative to normal LSK controls at individual CpGs in Idh2R140Q, Dnmt3AR878H, and Idh2R140Q/Dnmt3AR878H mutant mice.

