Fig. 2.
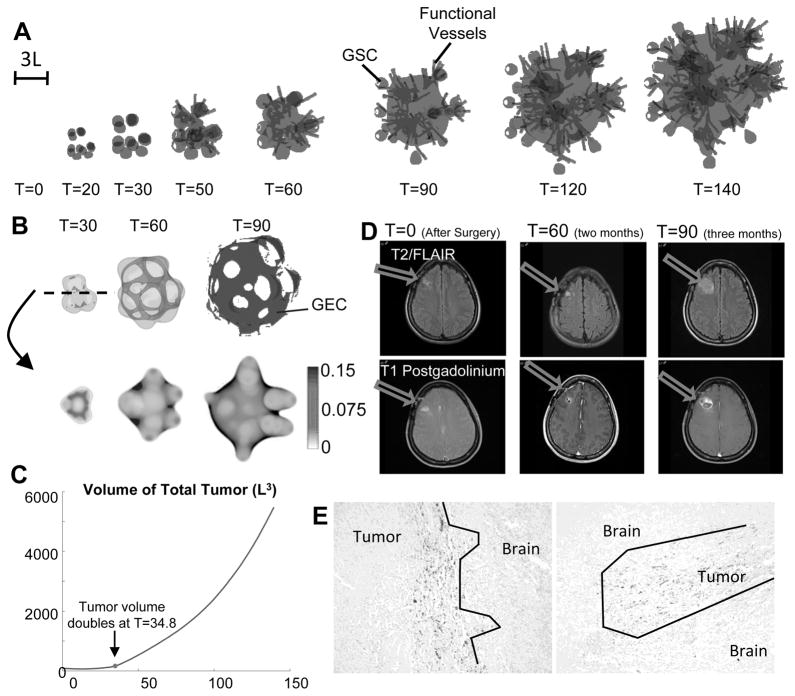
Evolution of untreated vascular tumor. (A) Spatial distribution of tumor cells (gray: tumor boundary; black: φGSC=0.3) and functional vessels (gray lines). Color version in SM. (B) Transdifferentiated GEC spontaneously form a network structure. Top: 3D isosurfaces of tumor boundary and φGEC=0.1 (dark gray) at T=30 and T=60. Bottom: 2D slices of φGEC at the center of computational domain. (C) Time evolution of total tumor volume. L is the diffusional length scale (≈ 250θM). At T=34.8, tumor volume doubles from T=0 (after surgery). (D) Exponential growth and central cavitation in a patient that declined treatment. Without treatment, tumor volume can double in 2–4 weeks. Two months after surgery, residual enhancement is gradually enlarging and more than doubled in size three months after surgery. (E) GBM infiltrates the normal brain. GSCs are positioned at the edge of the invading zone. Patient tumors, IHC staining with GSC marker, TRIM 11 (50).

