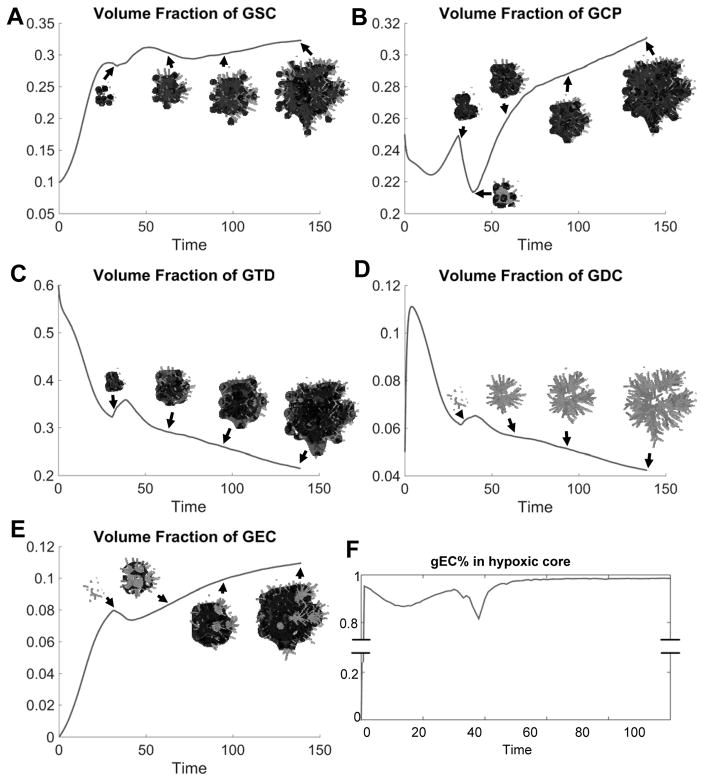
Fig. 3.
Detailed analysis of the untreated vascular tumor in Fig. 2A. (A–E) Volume fraction of GSC, GCP, GTD, GDCs and GEC. Insets show the corresponding cell type. Color version in SM. (F) Most transdifferentiated GEC locate within the hypoxic core (nutrient level less than half of that in background vasculature).

