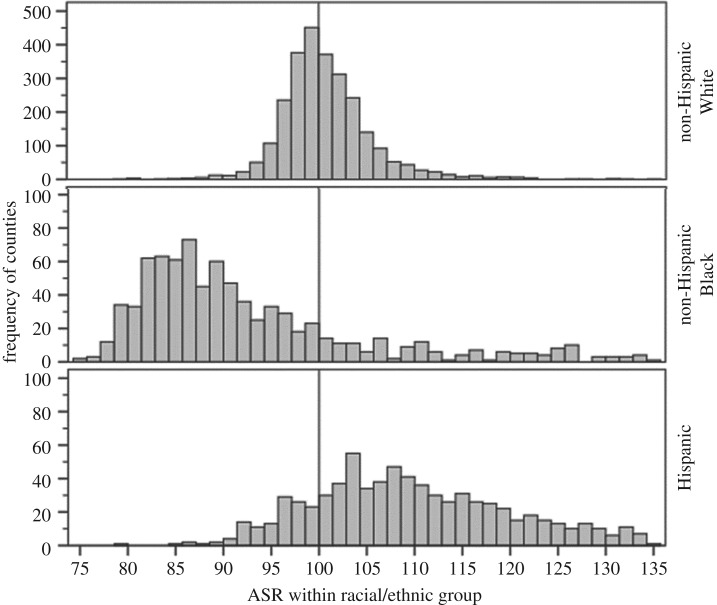
Figure 3.
Histograms of US county adult sex ratios for non-Hispanic White, non-Hispanic Black and Hispanic populations. Note. ASR, adult sex ratio (men per 100 women). ASR range is truncated to display the most frequent values. ASRs are calculated for counties with 1000 or more men and 1000 or more women in the 15–49 age group in the target racial category, after excluding prisoners using 2010 Decennial Census data [26]. Note that the scale for the non-Hispanic White population is 500 while that of the minority populations is 100 because there were fewer counties with minority populations. ASRs of 75, 100 and 135 are equivalent to male proportions of 0.429, 0.500 and 0.574, respectively.

