
FIGURE 4.
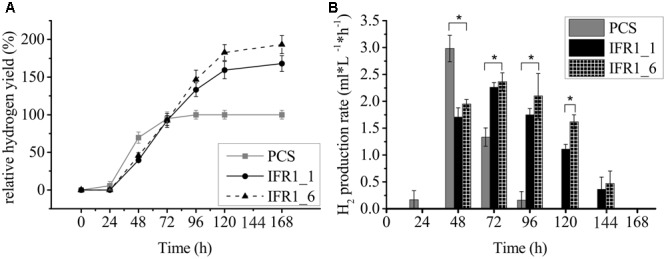
Prolonged hydrogen production in IFR1 knock-down strains compared to the wild type. (A) Time course of hydrogen production for the parental strain (PCS) and IFR1 knock-down strains. Hydrogen yields in the knock-down strains are given relative to the final yield of the parental strain (set to 100%). Each data curve represents an average of three biological replicates including three technical triplicates (n = 9) with error bars representing the standard error. (B) H2 production rates during the course of hydrogen production. Error bars indicate the standard error (n = 9) and asterisks indicate differences between PCS and knock-down strains which are significant according to a two-tailed Student’s t-test (∗p < 0.05).