
FIGURE 5.
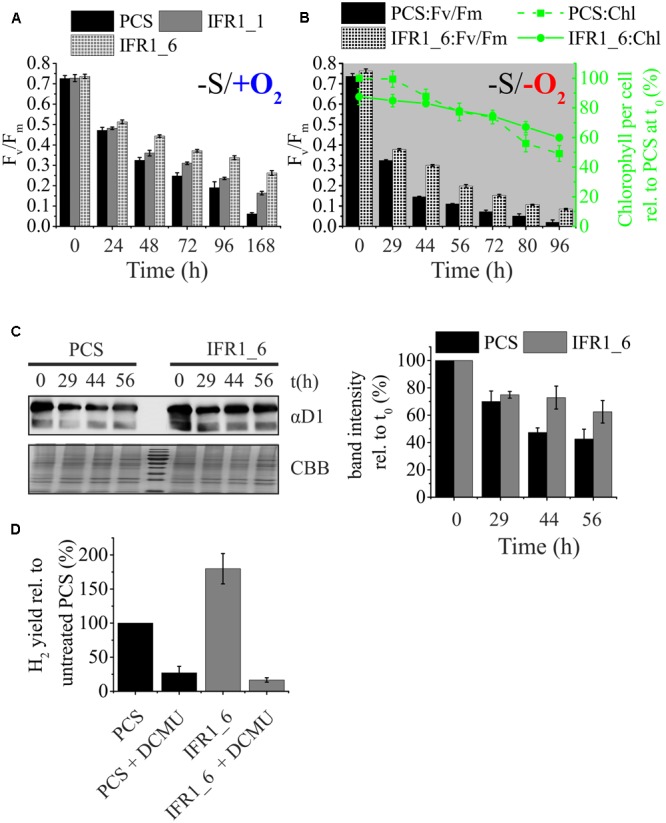
Contribution of PSII and photosynthetic/respiration (P/R) rates on hydrogen production. (A) Maximum quantum yield (Fv/Fm) of dark-adapted cells of the parental strain (PCS) and IFR1 knock-down strains (IFR1_1/IFR1_6) before (t0) and after exposure to sulfur limitation (t24–t168 h) and aerobic conditions. Error bars indicate the standard error from three biological replicates (n = 3). (B) Time course of the maximum quantum yield (Fv/Fm; left y-axis) and the cellular chlorophyll content (right y-axis) during photosynthetic hydrogen production of the parental strain (PCS) and one of the IFR1 knock-down strains (IFR1_6). Chlorophyll data were normalized to the chlorophyll content of PCS at t0 (set to 100%). Standard errors derived from three biological replicates (n = 3) are indicated as error bars. Except for t0, the differences between PCS and IFR1_6 in regard to Fv/Fm were significant according to a two-tailed Student’s t-test (p < 0.05). (C) Representative immunoblot showing the immunodetection of PSII subunit D1 (upper left panel; αD1) in samples of the parental strain (PCS) and IFR1_6 taken at indicated times during a hydrogen production experiment. A colloidal Coomassie stain (lower left panel; CBB) served as a loading control. Results from densitometric scanning (right panel) of blot signals are given relative to the D1 signal intensity determined for t0 (set to 100%). Error bars indicate standard errors (three biological replicates; n = 3). (D) Relative H2 yields obtained with the parental control strain (PCS) (black bars) and knock-down strain IFR1_6 (gray bars) in the absence or presence of 20 μM DCMU. Hydrogen yields determined for the untreated PCS were set to 100%. Error bars represent standard error (n = 6).