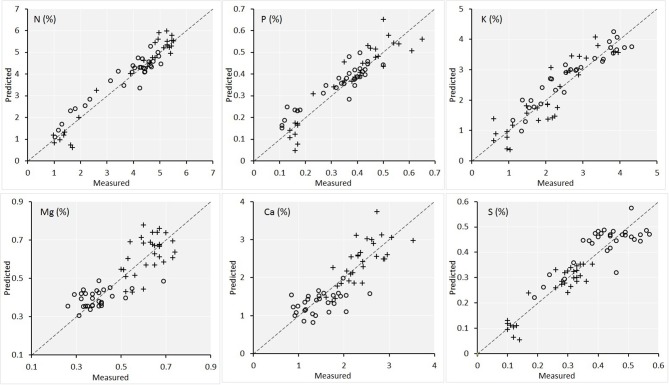
Figure 6.
Scatterplot of the lab measured value vs. the image predicted value of the concentrations of the six macronutrients in plant leaves for the validation set (n = 60). Maize plants are denoted by circles and soybean plants are denoted by crosses. The statistics of the plots are given in Table 1.

