
FIGURE 2.
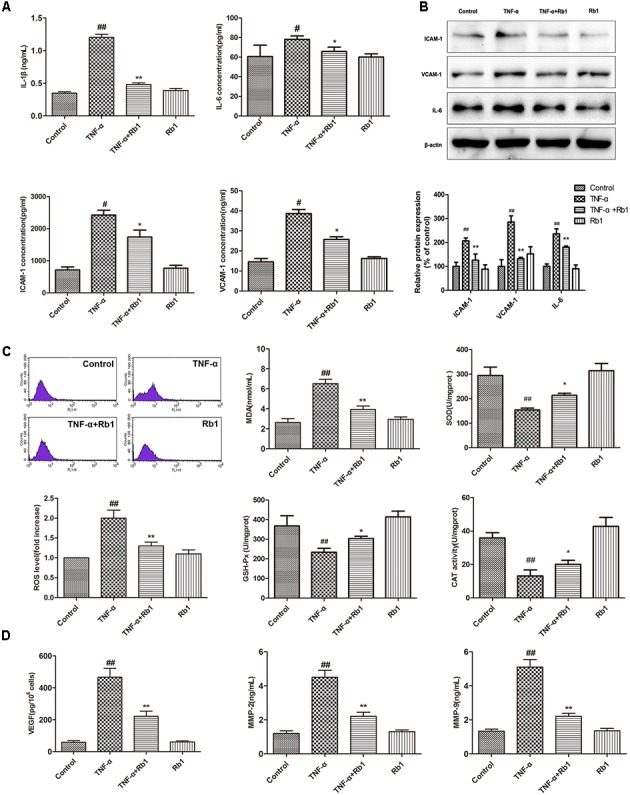
Ginsenoside Rb1 could suppress TNF-α-induced inflammation in HUVECs. HUVECs were treated with TNF-α for 24 h after incubation with Rb1 (20 μg/mL) for 8 h. (A) The levels of IL-1β, ICAM-1, VCAM-1, and IL-6 were measured by ELISA. (B) The protein expression levels of ICAM-1, VCAM-1, and IL-6 were determined by western blot and quantified using densitometric analysis. (C) ROS levels were detected by flow cytometry, and the levels of MDA and the activities of SOD, CAT, and GSH-Px were detected by respective assay kits. (D) The levels of VEGF, MMP-2, and MMP-9 in HUVECs were detected by ELISA. Data were expressed as the mean ± SD of three independent experiments. ##P < 0.01 vs. control group; ∗P < 0.05, ∗∗P < 0.01 vs. TNF-α treatment group.