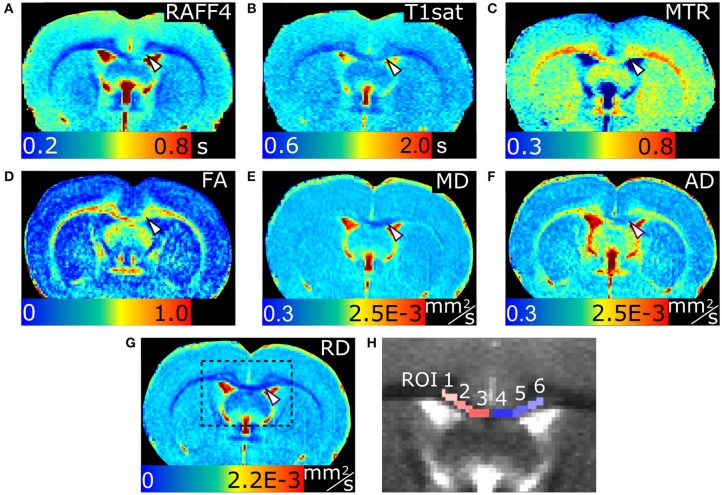
Figure 1.
MRI parameter maps of a representative rat, 3 days after an LPC injection into the corpus callosum. Relaxation time constant map of RAFF4 (A), T1sat (B), magnetization transfer ratio, MTR (C), fractional anisotropy, FA (D), mean diffusivity, MD (E), and axial and radial diffusivity, AD and RD (F,G). Representative examples of ROIs for analyzing lesions in the corpus callosum are shown on a grayscale RAFF4 map in (H). White arrowhead points to demyelinated lesion in (A–G).

