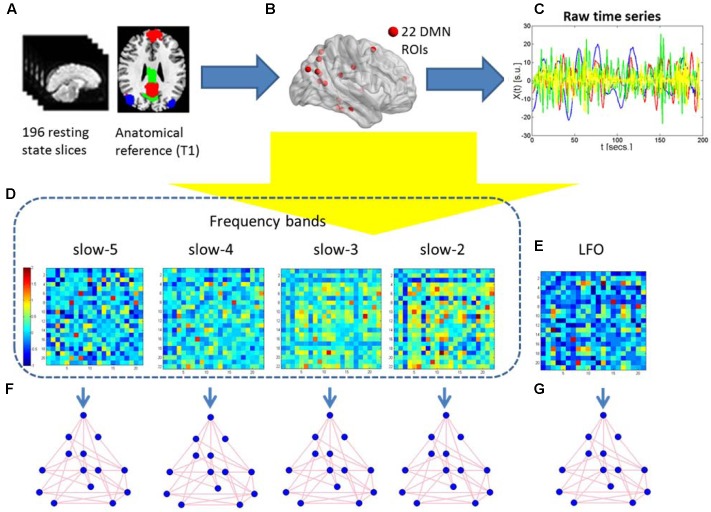
FIGURE 2.
Schematic representation of the construction of frequency dependent default mode networks. (A) The 196 resting-state fMRI slices are co-registered to the anatomical T1 3D reference volume, and each voxel is mapped to one of the 22 ROIs in the MNI atlas. (B) The 22 DMN ROIs are obtained. (C) For each ROI, the raw time series of different frequency is retrieved using the 196 fMRI slices. (D,E) Five correlation matrices are obtained from the previous time series of the four different frequency bands and the standard LFO. They are Z-transformed to normalize correlation values across individuals. Warm (cold) colors in these matrices represent large (small) correlation values between ROIs. (F,G) Graph-theoretical measures of edge weight are obtained for each pair of DMN regions, to be analyzed using NBS.

