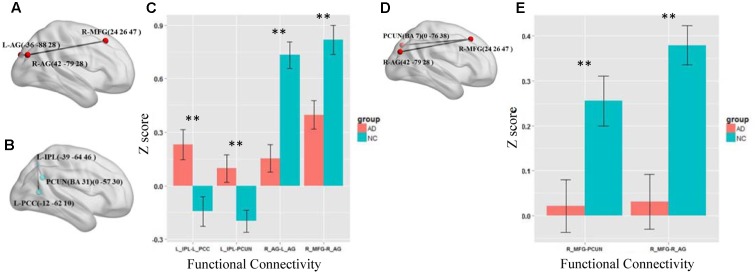
FIGURE 3.
The altered functional connections in the slow-5 and slow-4 bands. (A) The decreased functional connectivity pattern of the AD group compared with the NC group in the slow-5 band. The functional connections of L_AG-R_MFG (L, means left side, R, means right side) and R_AG - L_AG are significantly decreased. (B) The increased functional connectivity pattern of the AD group compared with the NC group in the slow-5 band. The functional connections of L_IPL-PCUN, the L_IPL-L_PCC are significantly increased. (C) The differences in mean Z scores of the altered functional connections in the slow-5 band. (D) The decreased functional connectivity pattern of the AD group compared with the NC group in the slow-4 band. The functional connections of R_AG -R_MGF and PCUN-R_MFG are significantly decreased. (E) The differences in mean Z scores of the altered functional connections in the slow-4 band.

