Figure 3.

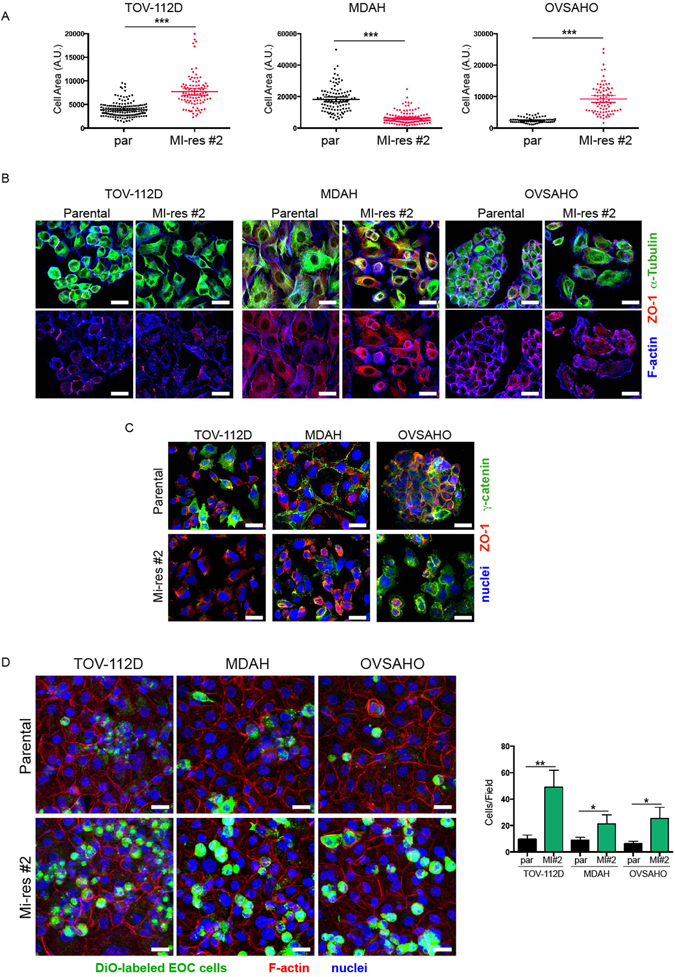
MI-res cells show altered cell morphology. (A) Dot plot showing the area of parental and MI-res cells in exponentially growing conditions. Data were obtained using the ImageJ software and each dot corresponds to one cell. At least 80 cells were scored for each cell line. Statistical significance was determined by a two-tailed, unpaired Student’s t-test (***p < 0.001). (B) Representative images of parental and MI-res cells, immunostained for the expression and localization of α-tubulin (green), ZO-1 (red) and F-Actin (blue), are reported. Scale bar = 25 µm. (C) Representative images of γ-catenin (green) and ZO-1 (red) in parental and MI-res cells cultured in exponentially growing conditions. Nuclei are in blue. Scale bar = 25 µm. (D) Maximal projections of images of parental and MI-res cells labeled with the green fluorescent marker DiO (green) and cultured on a monolayer of mesothelial cells for 24 hours. Cells were then fixed and stained with Phalloidin (F-Actin, red) and TO-PRO3 (nuclei, blue). In the right graph, the number (mean ± SD) of cancer cells/field is reported. Statistical significance was determined by a two-tailed, unpaired Student’s t-test (*p < 0.05 and **p < 0.01) (MI#2 = MI-res#2).
