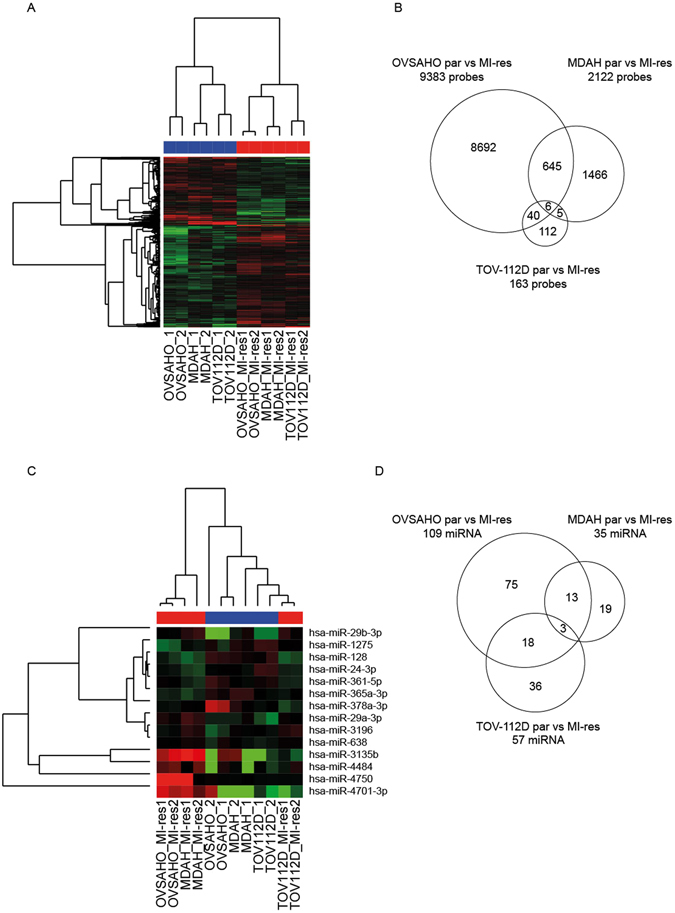
Figure 6.

Expression of coding and non-coding genes does not identify common gene expression alteration in MI-res cells. (A) Heat map of supervised clustering analyses evaluating the expression of coding and long non-coding RNAs in parental and MI-res cells, as indicated. (B) Venn diagram showing the genes differentially expressed between parental and MI-res cells, in each cell line. Few genes were commonly altered in the three models and none in the same direction (i.e. always increased or decreased in MI-res vs parental cells). (C) Heat map of supervised clustering analyses evaluating the expression of microRNAs in parental and MI-res cells, as indicated. (D) Venn diagram showing the microRNAs differentially expressed between parental and MI-res cells in each cell line. Only 3 microRNAs were commonly altered in the three models and none in the same direction (i.e. always increased or decreased in MI-res vs parental cells). For both coding and non coding gene expression analyses, 2 samples for each parental and 2 for each MI-res cell line were analyzed.
