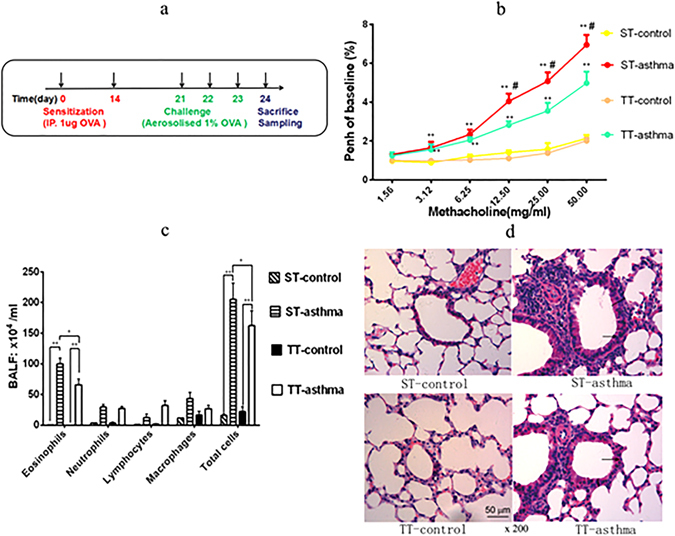
Figure 1.

Effects of the changing ambient temperature on asthma mice. (a) The experimental procedures using to develop an asthma mouse model was generated by using OVA sensitization and challenge. (b) The AHR in mice after being inhaled Mch was measured recorded using flow plethysmography. (c) Total and differential cells numbers in BALF that were determined by microscopyicobservation. The data were averaged from for five randomly selected fields of each mouse. (d) The representative photomicrographs (200×)of lung sections are shown. Black arrows indicate areas of peribronchiolar inflammatory cell influx and edema. Black bars indicate the amount of bronchiolar remodeling. ST: standard temperature (20 °C); TT: thermoneutral temperature (30 °C). The data presented are mean ± SEM. ** denotes P < 0.01 (ST-control vs. ST-asthma or TT-control vs.TT-asthma); # denotes P < 0.05 (TT-asthma vs. ST-asthma) in Fig. 1b. * or ** denotes P < 0.05, P < 0.01 respectively between two groups in Fig. 1c,d (n = 6 mice per group).
