Figure 1.

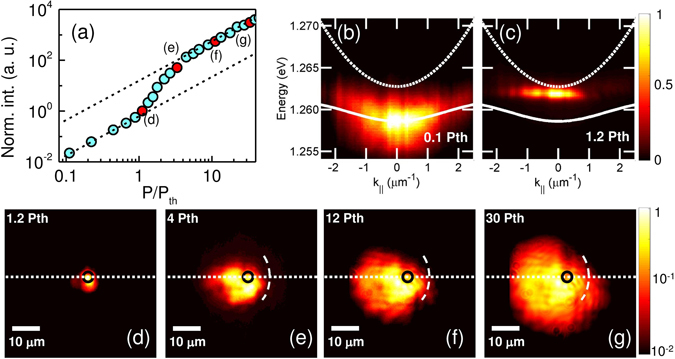
Distribution of polariton condensate in a time-integrated picture. (a) Power-dependent input-output characteristics of the polariton condensate emission. Power dependent k-space emission below (b) and above (c) the regime of polariton condensation. Bare cavity mode is depicted as dotted line and lower polariton branch as a white thick line. The bottom panel presents the real space distributions of polariton condensate at different excitation levels above the condensation threshold P th, (d) 1.2 P th, (e) 4 P th, (f) 12 P th and (g) 30 P th. The pseudo-color scale is logarithmic. The pump spot size and location is indicated as a black circle. The strong defect wall is indicated with a curved dashed line (guide to the eye). The system detection slit, the direction where the spectra are cut, is indicated as a dotted line.
