Figure 1.

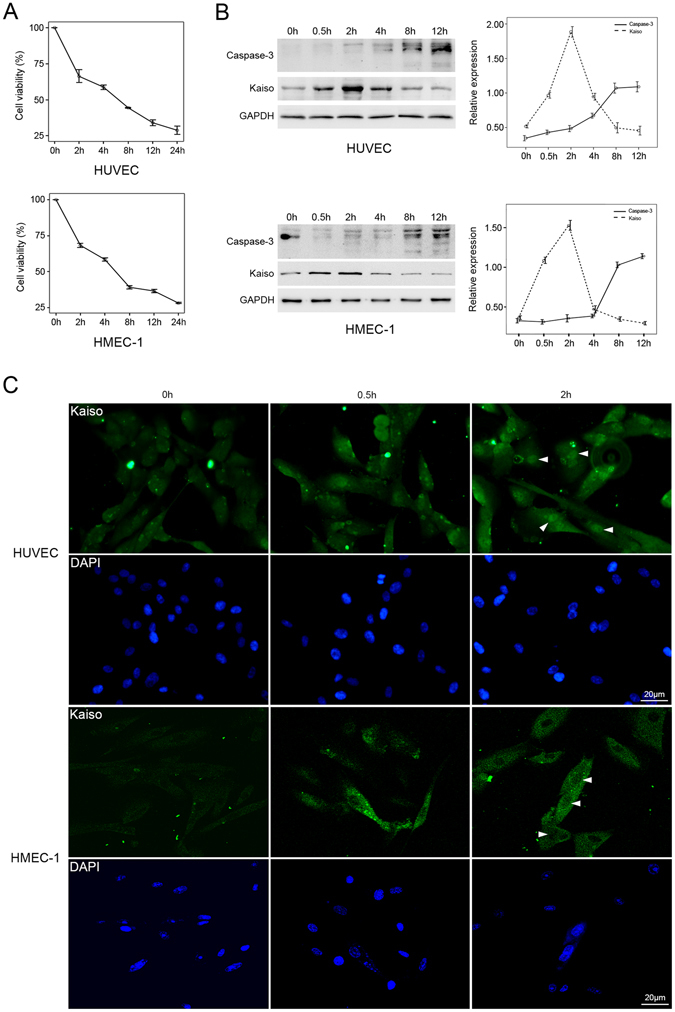
Kaiso expression in H2O2-treated endothelial cells. Cells were treated with 400 μM H2O2 for 0, 2, 4, 8, 12, and 24 h and cell viability was analyzed at the end of each time period using CCK8 method (A). Results are presented as mean ± SD of triplicate (n = 3) experiments. Cells were treated with 400 μM H2O2 for 0, 0.5, 2, 4, 8, and 12 h and the protein expressions of Kaiso and Caspase-3 were analyzed using Western blot (B, left panel). GAPDH served as loading control. Representative curves of relative protein expressions of Kaiso and Caspase-3 are presented as densitometric values corrected by GAPDH (B, right panel). Experiment was performed in triplicate (n = 3). Cells were treated with 400 μM H2O2 for 0, 0.5, and 2 h and stained with monoclonal mouse anti-Kaiso 6F/6F8-CHIP grade antibody (C). Cell nuclei were stained with DAPI. Arrowheads show the nuclear expression of Kaiso. Scale bar represents 20 μm.
