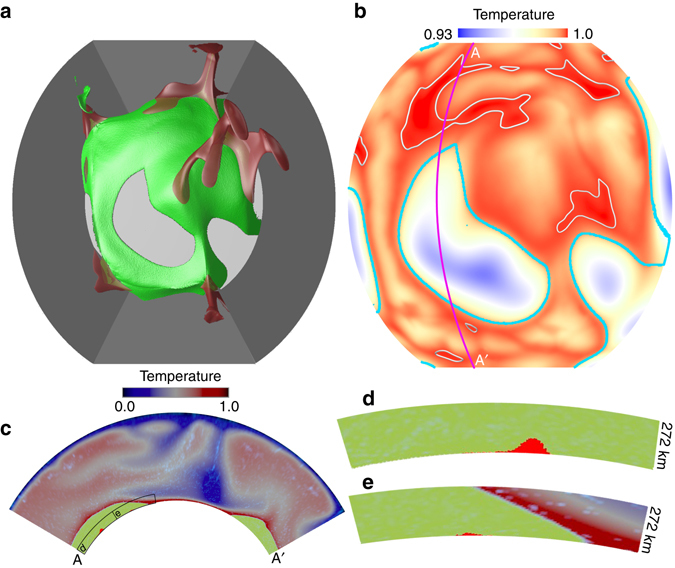
Fig. 1.

Morphology and distribution of ULVZs caused by partial melting. a Top view of the model with mantle plumes (red isosurface of temperature of 0.683) forming on tops of thermochemical piles (green isosurface). The gray side boundaries define the domain of the 3D partial spherical geometry of the model, which spans 120° in both longitudal and colatitudal directions. The downwellings (not shown) sweep pile material away, exposing the core (light gray) in these regions. b Temperature field in map-view at 5 km above the CMB. Light gray contours at T = 0.999 show the hottest 10% regions of the piles by area. Thick cyan lines show the edges of piles. c Cross-section at locations marked by magenta line in Fig. 1b. The temperature field is shown by dark blue to red color, the thermochemical piles are shown in green color in the lowermost mantle, and the small red patches within the piles at the bottom of the mantle show the hottest regions. d, e Zoomed-in at the regions outlined by black boxes in Fig. 1c. The hottest regions (red patches inside the pile) are candidate regions for melting, and we identify the hottest regions where temperature is higher than mantle solidus. At 5 km above CMB, the hottest 10% pile regions by area are identified as candidate regions for melting by assuming a mantle solidus of T = 0.999 (non-dimensional) at this depth. For other depths, the mantle solidus decreases with decreasing depth with a rate of ~0.8 K km−1 38. All panels a–e are shown at 218 Myr
